
 Download als PDF File
## 1. What Netdash Is
Netdash is a super lightweight solution for Fortigate Firewalls, that gives you everything at a glance without requiring additional licenses. It is built entirely around HTTPS webhooks, so there is no polling overhead and no heavy management stack to maintain.
The platform combines:
– „live“ device status
– customer and technician context
– licensing and renewal tracking
– release compliance against golden images
– patchday planning and verification
– webhook configuration
– log/troubleshooting
It is an operational workspace for day-to-day firewall asset management.
—
## 2. Page Structure and Navigation
The main navigation is organized around the actual workflows an operations team needs.
Main areas:
– Dashboard
– Firewall overview
– Unit details
– Licenses
– Golden Images
– Patchday
– Service & Support
– Customers
– Technicians
– Webhooks
– Troubleshoot
– Roadmap
—
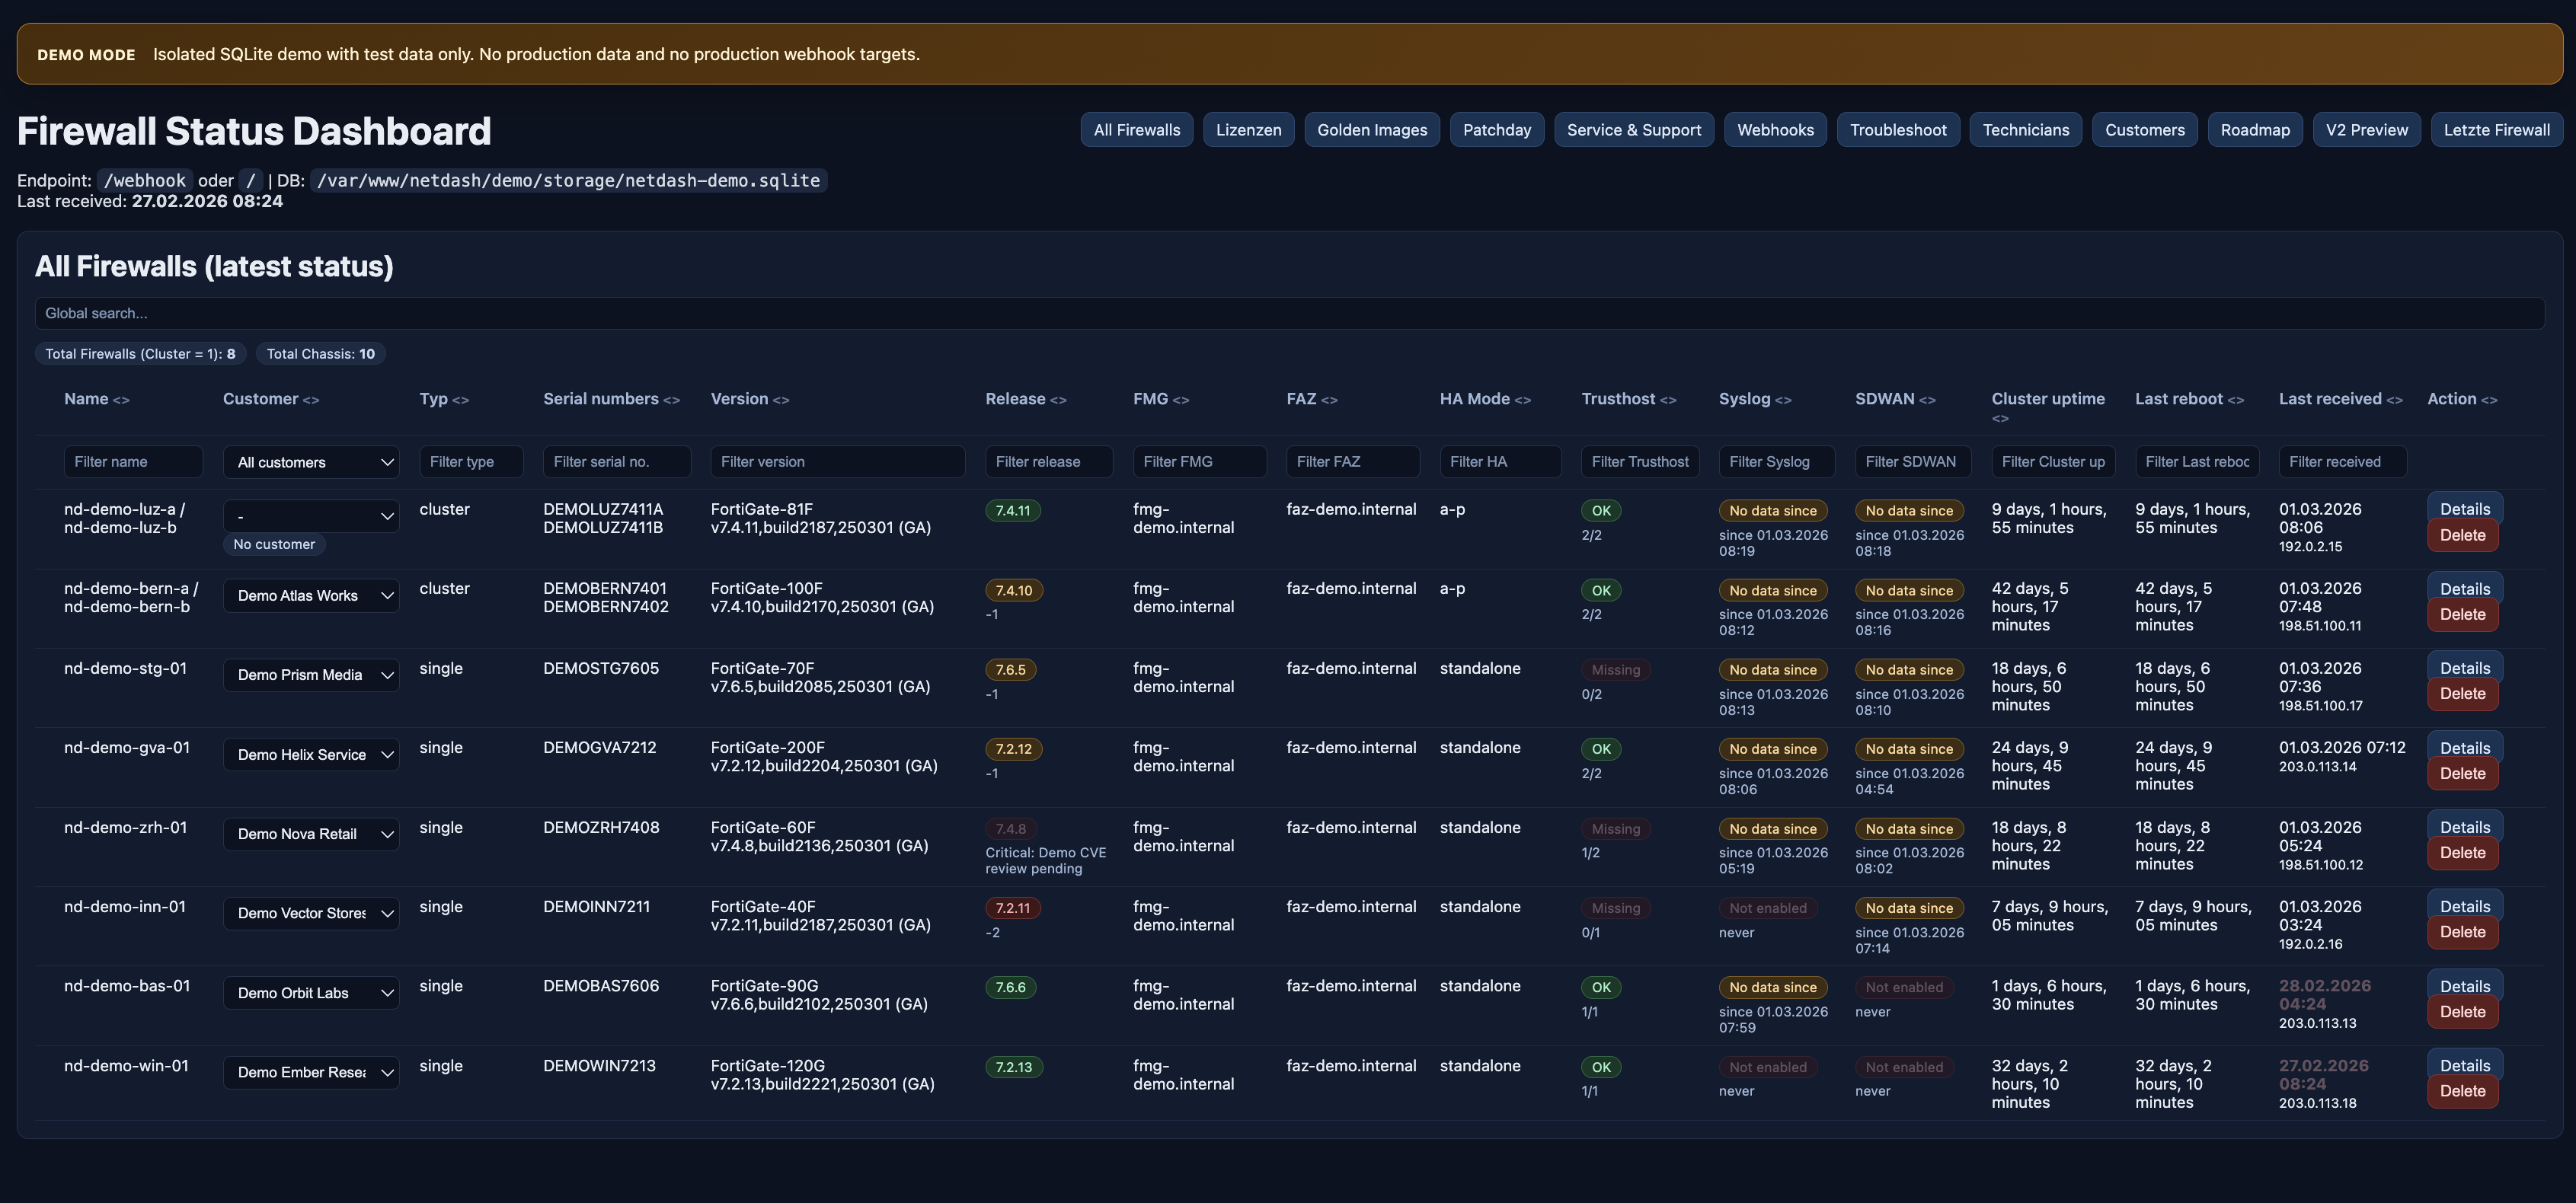
## 3. Dashboard: The Operational Entry Point
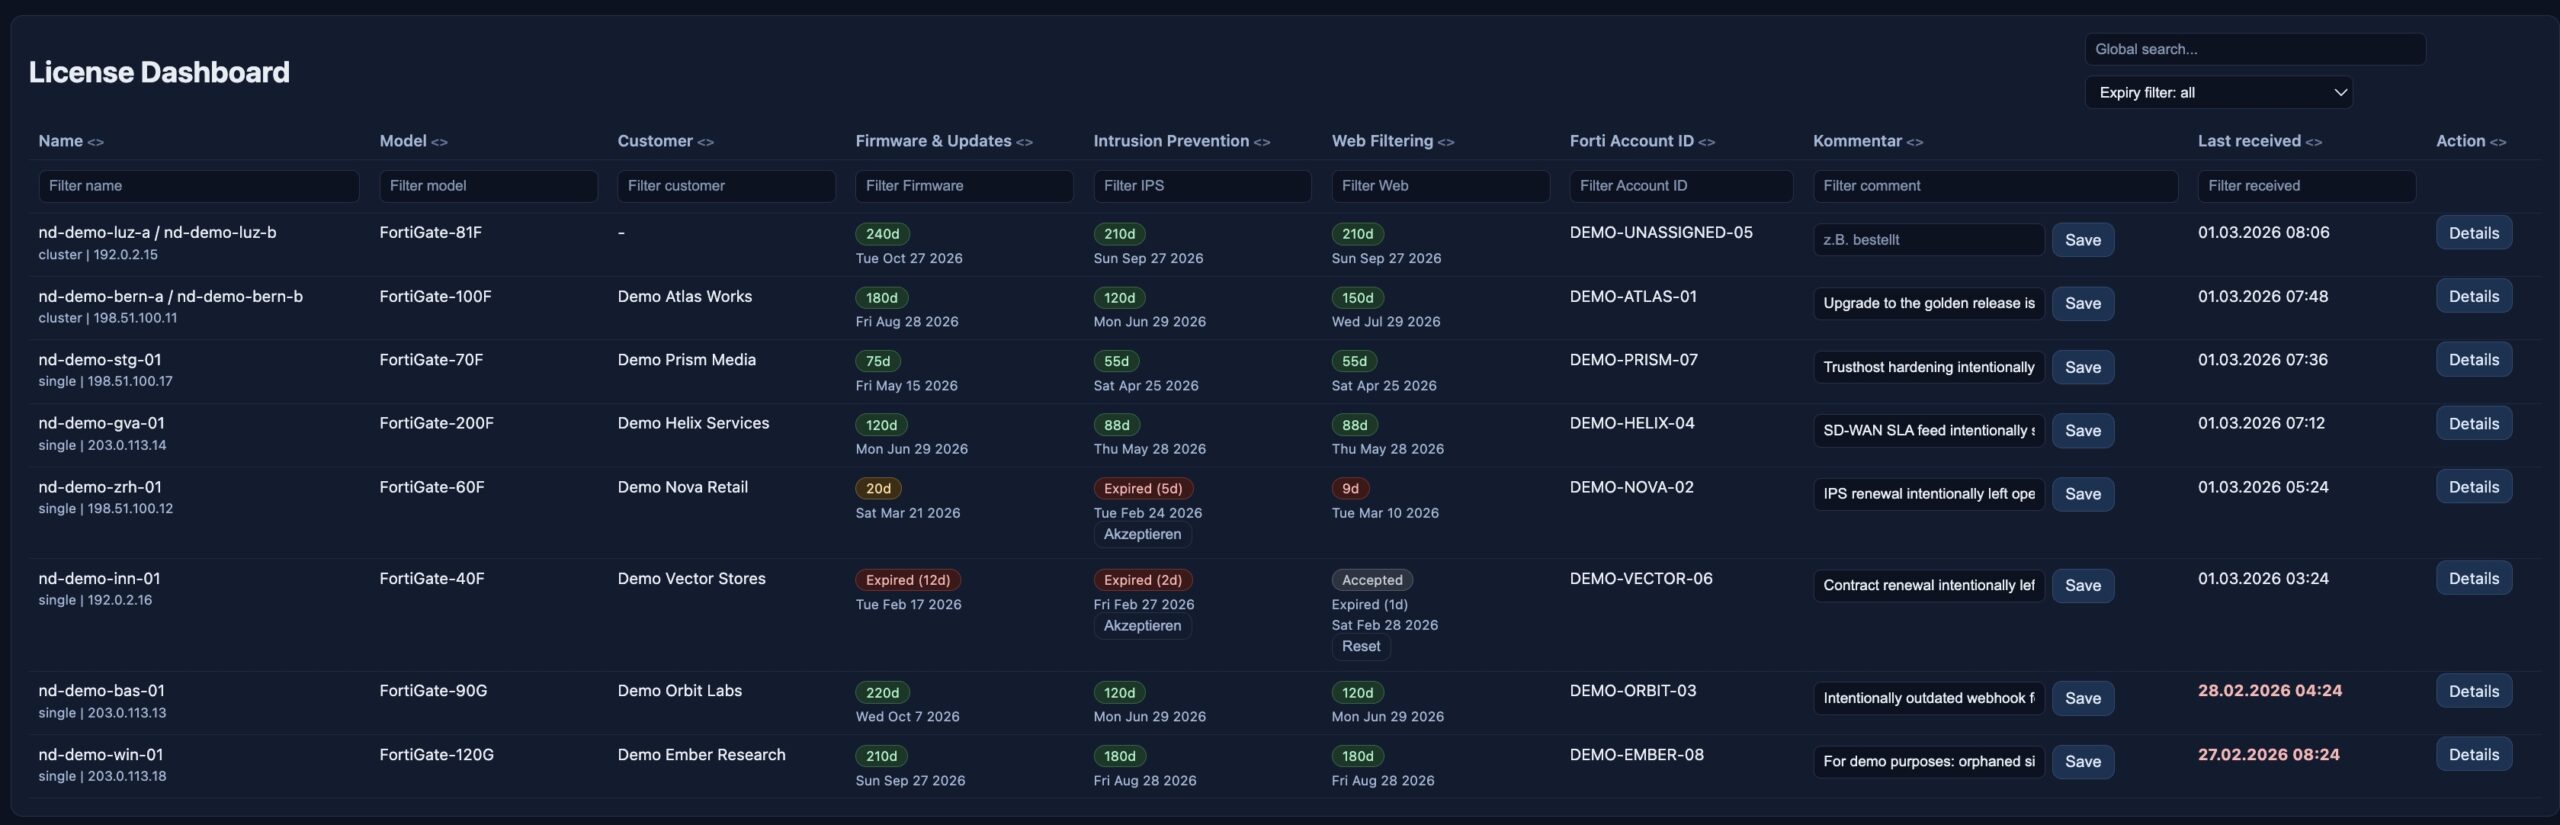
The dashboard is the starting point for daily operations. It provides a consolidated view of the current state of all managed firewalls and clusters.
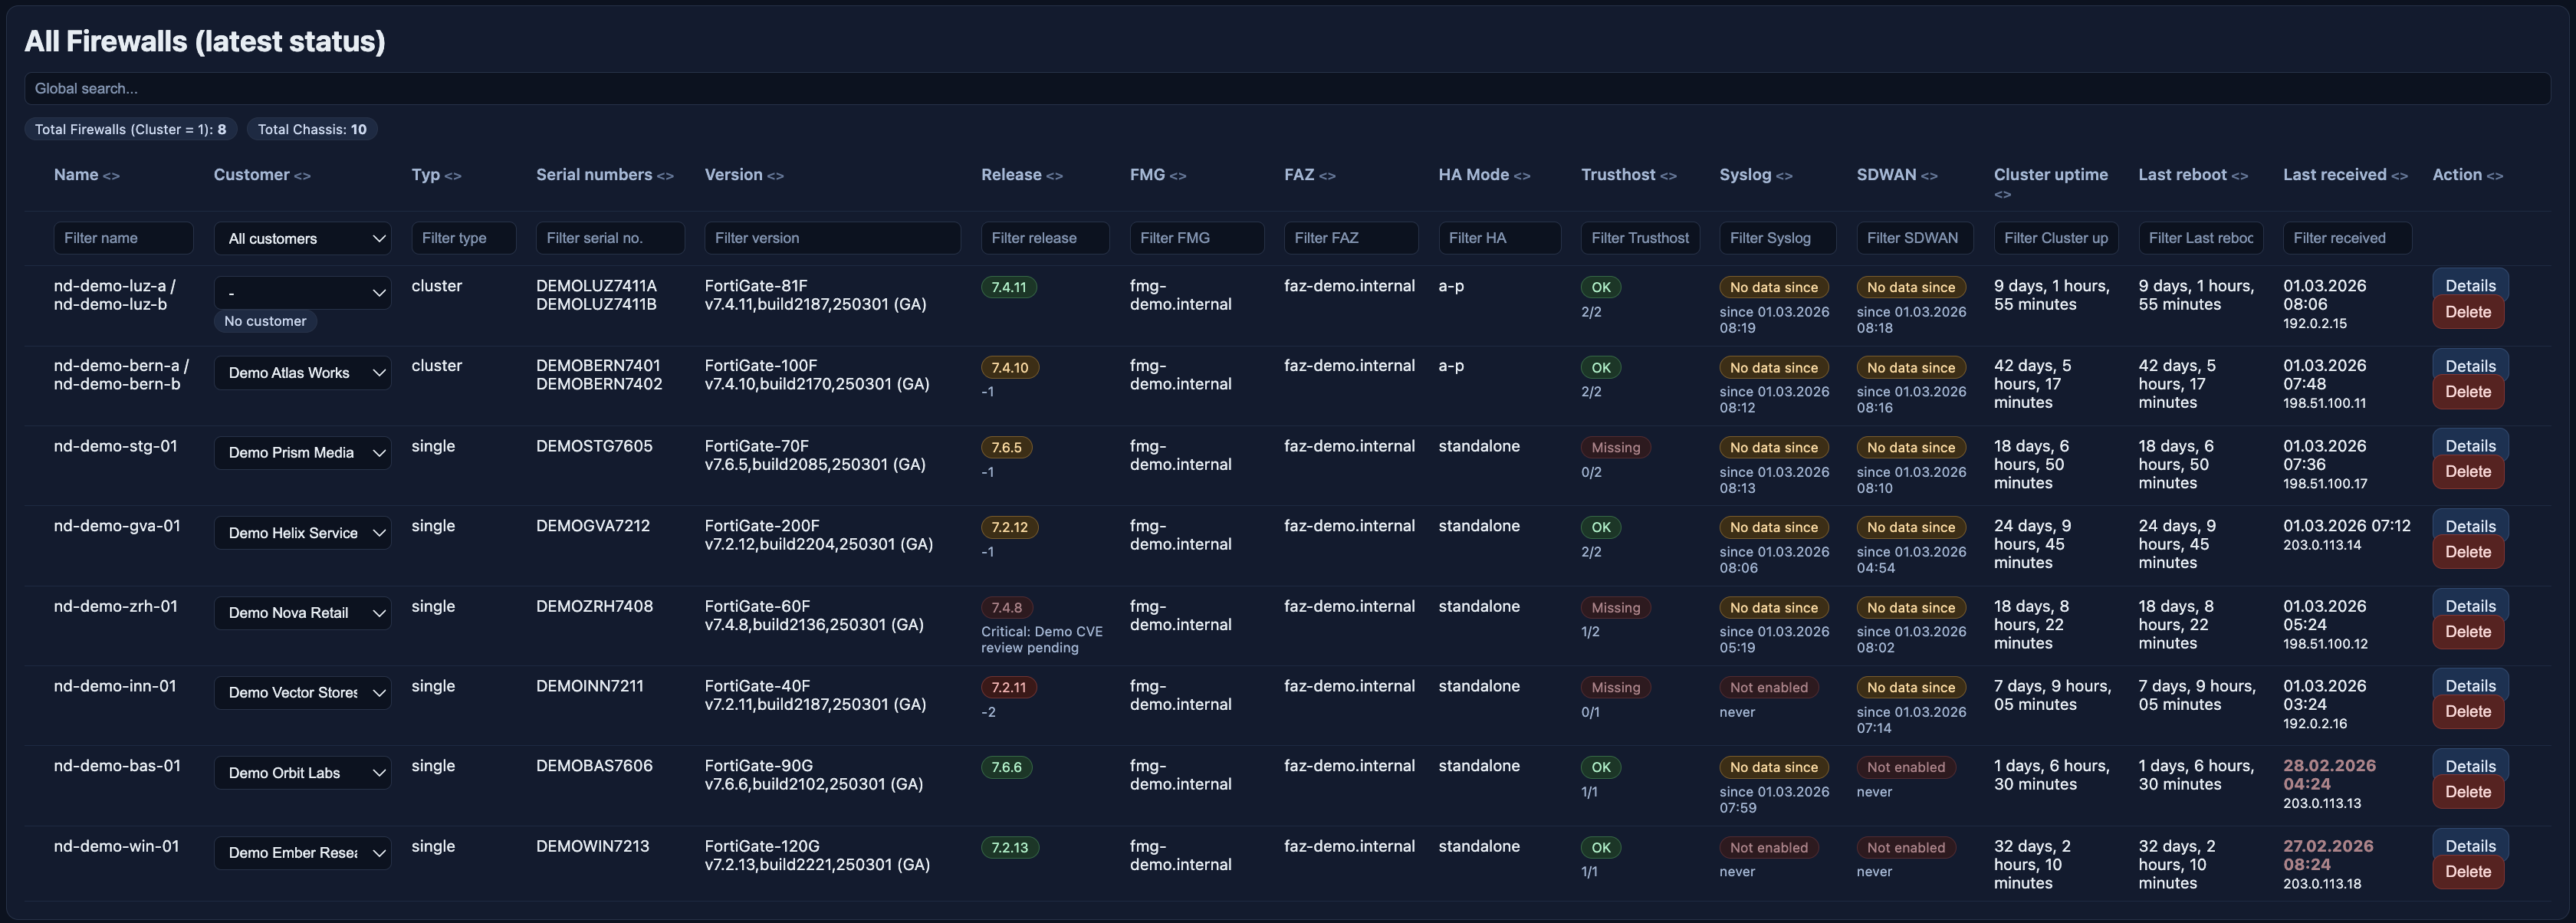
Typical information visible on the dashboard:
– firewall or cluster name
– assigned customer
– device type
– serial numbers
– firmware version
– release compliance state
– FMG and FAZ connectivity
– trusthost health
– syslog and SD-WAN status
– uptime and reboot information
– latest webhook timestamp
The dashboard is built for prioritization. Systems with stale webhook activity, outdated versions, missing trusthost hardening or missing telemetry immediately stand out.
The Function of Syslog and SDWAN will be covered in the next blog article.. 🙂
—
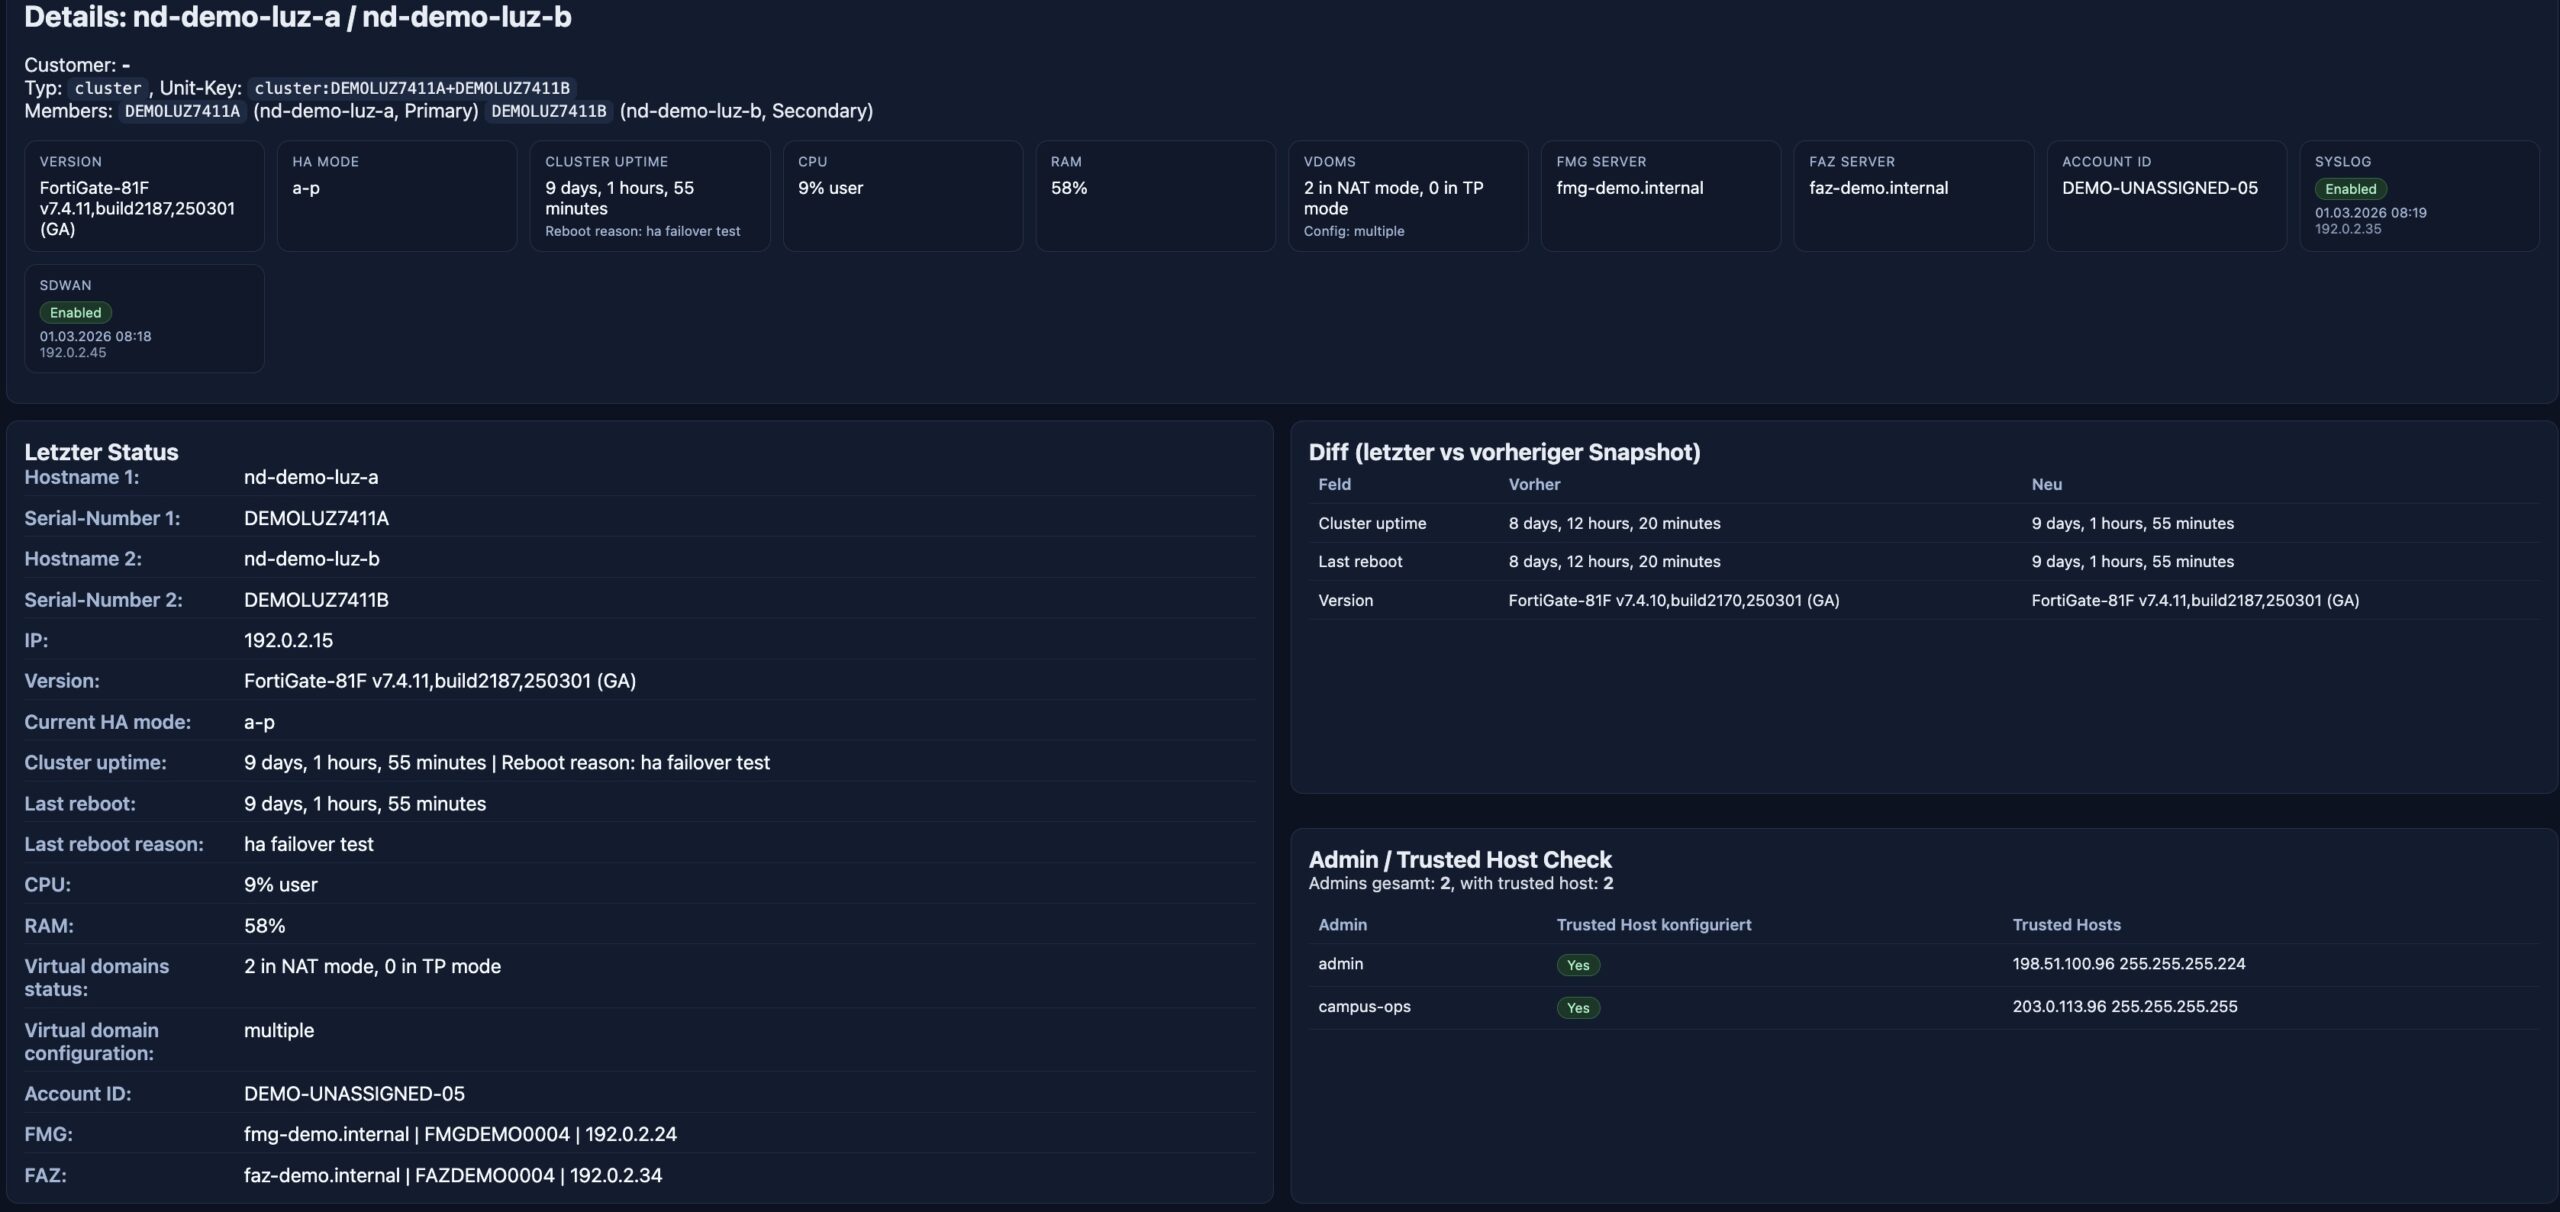
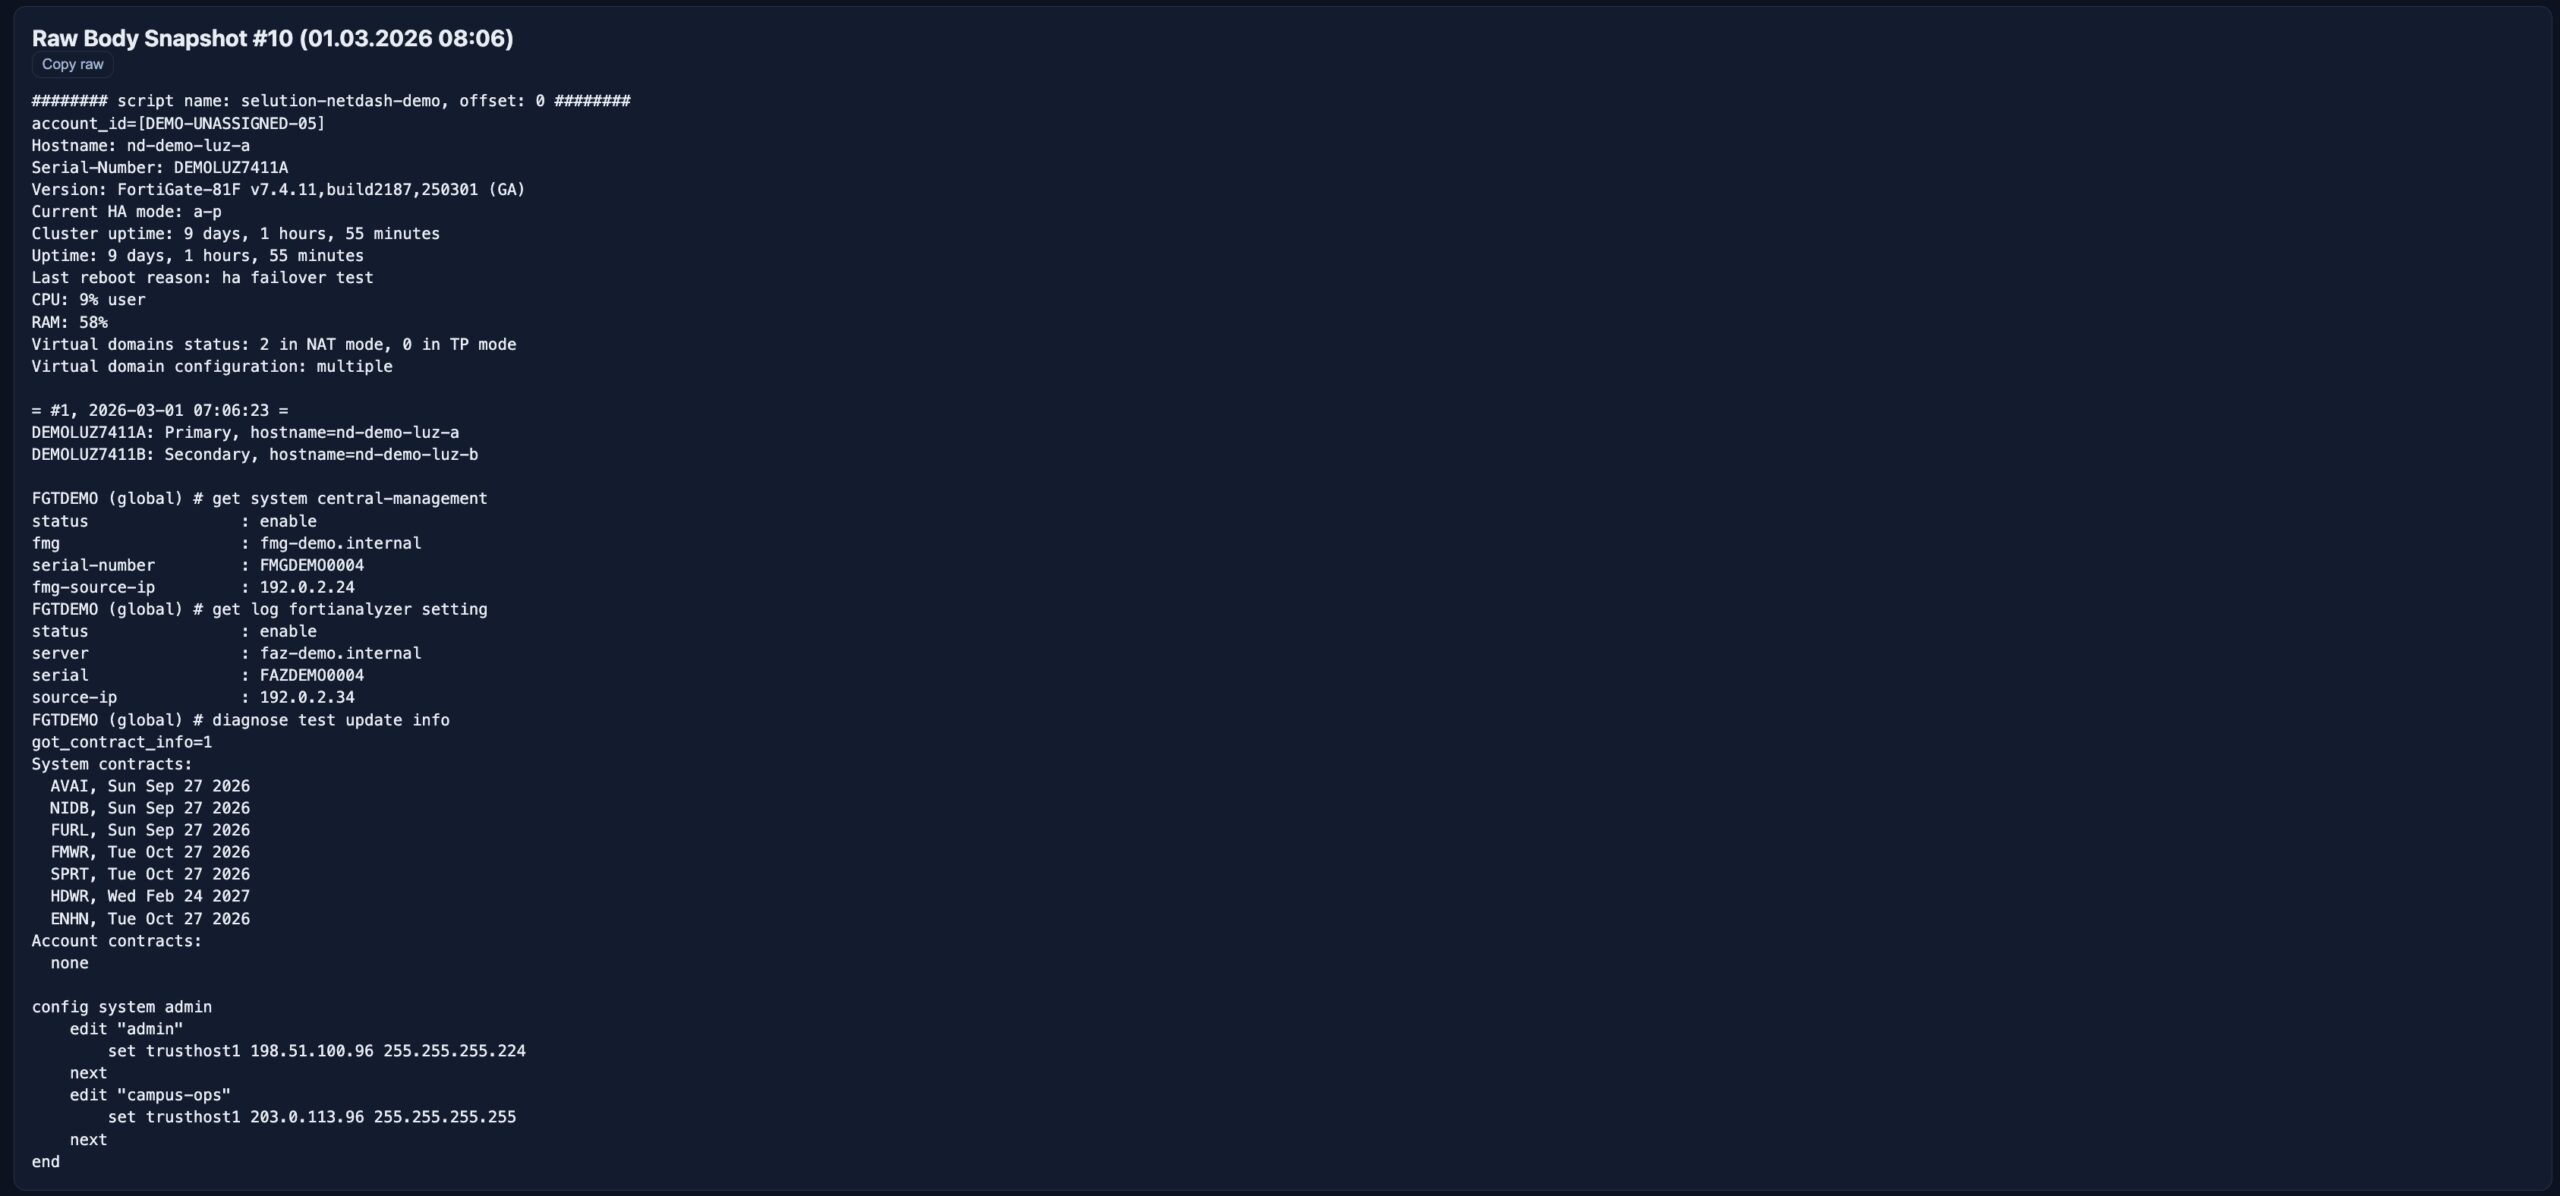
## 4. Unit Details: Going from Summary to Raw Data
Each firewall or cluster has a detail view that moves from overview to technical depth.
The unit detail page includes:
– version and HA mode
– CPU and RAM
– FMG and FAZ information
– account ID
– VDOM status
– syslog and SD-WAN health
– snapshot history
– raw snapshot output
– snapshot diffs
– trusthost checks for admin accounts
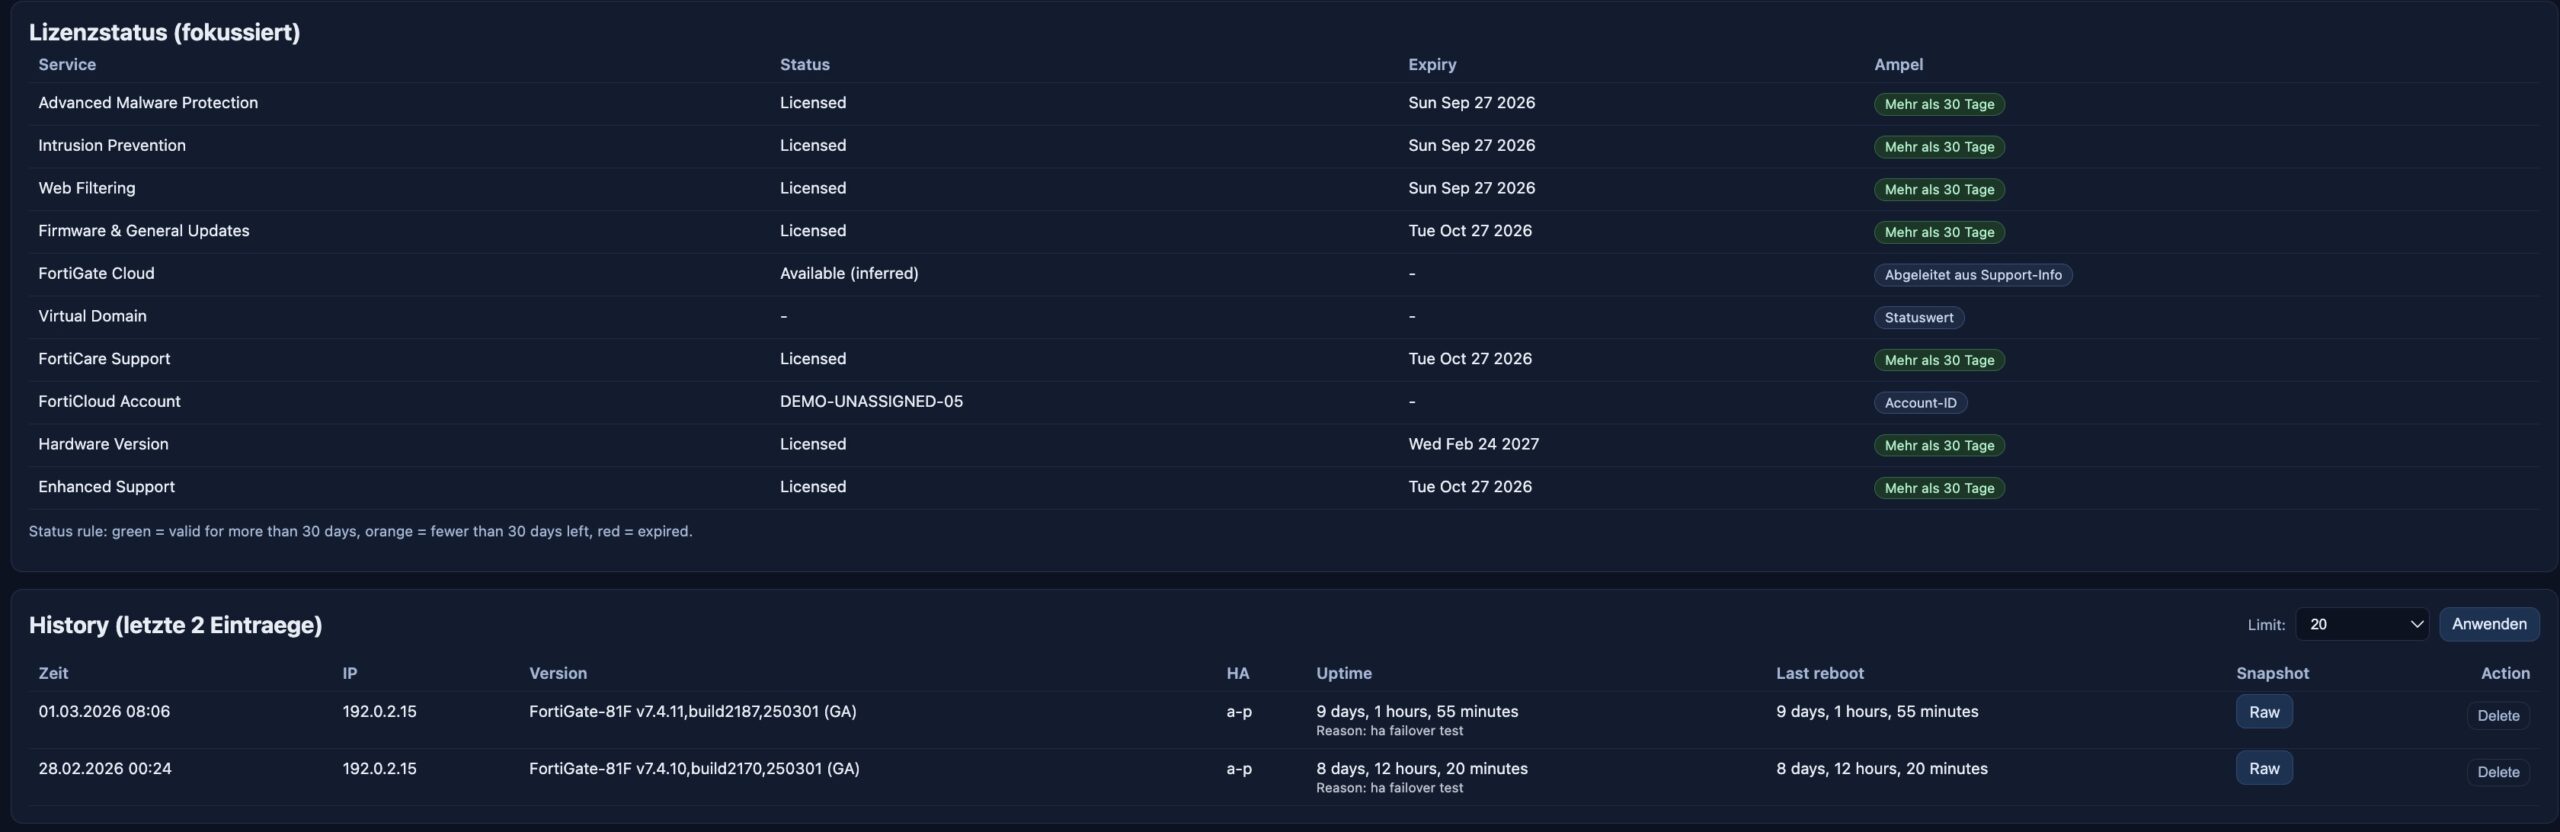
– focused license information
—
## 5. License Management Inside the Same Workflow
The license dashboard turns subscription and support data into operational status.
It focuses on the service categories that usually matter most:
– Firmware & General Updates
– Intrusion Prevention
– Web Filtering
Instead of just listing expiration dates, Netdash shows practical states such as:
– active
– expiring soon
– expired
– acknowledged warning for specific add-on services
Operators can also store per-device notes such as:
– renewal in progress
– customer informed
– intentionally excluded
– purchase pending
That makes the page useful not only for reporting, but also for coordination between technical and commercial follow-up.
—
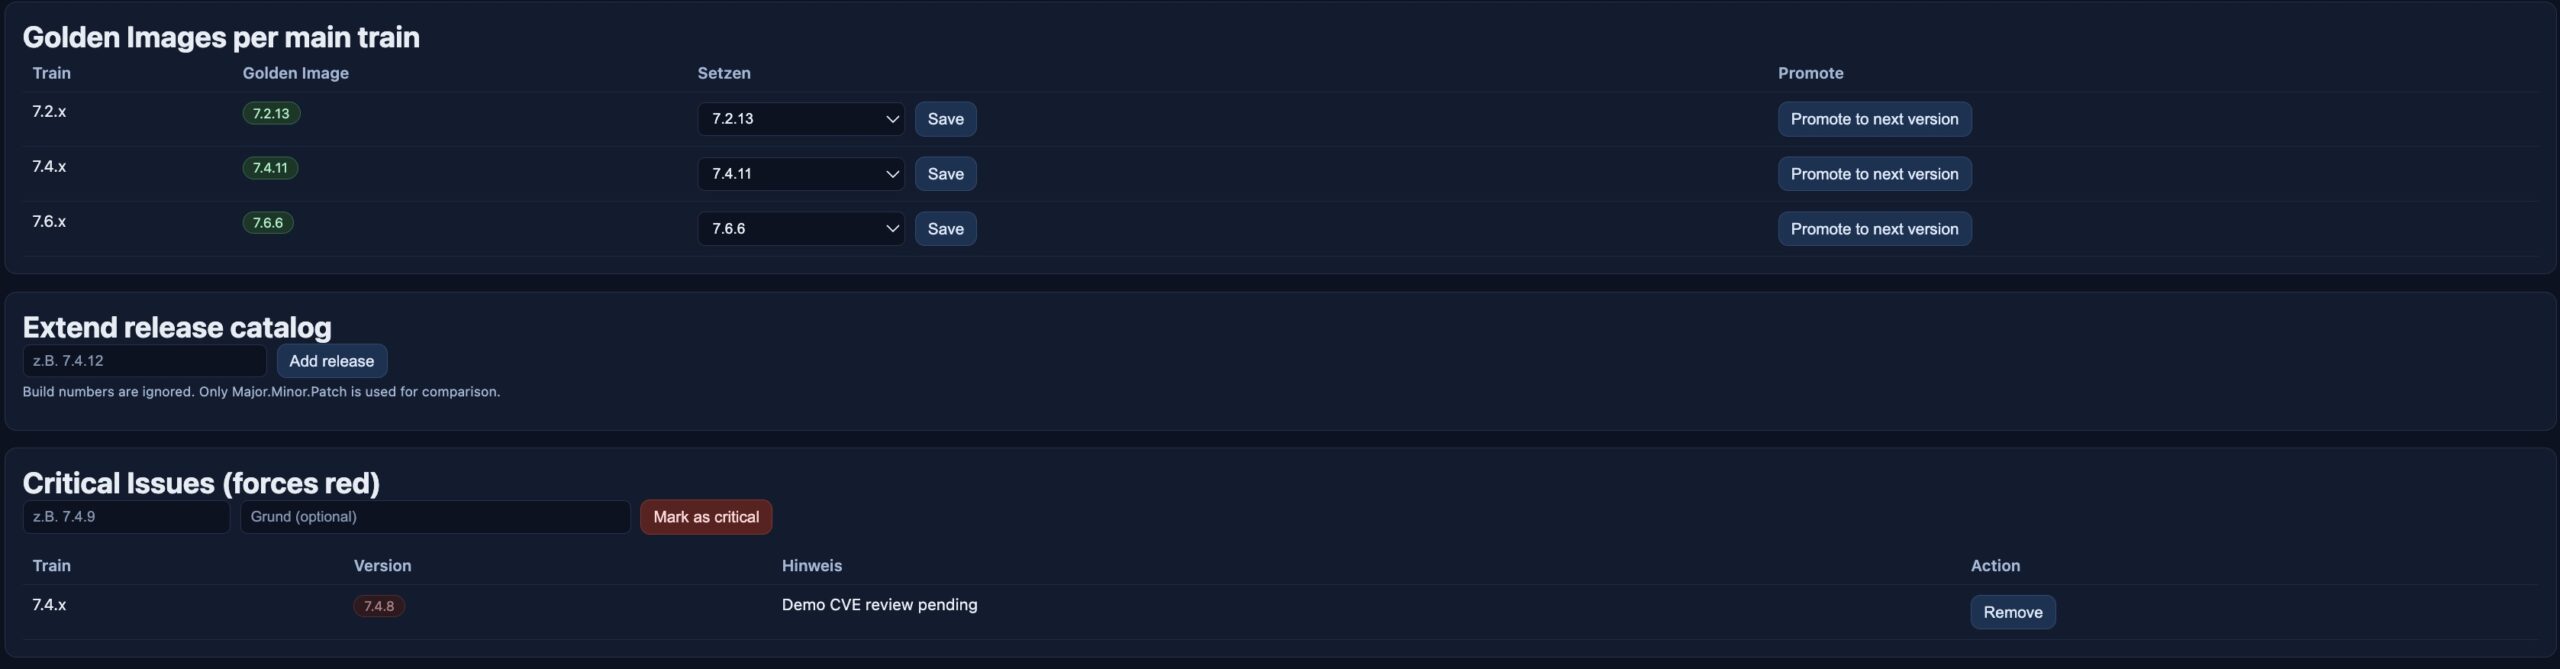
## 6. Golden Images and Release Compliance
Netdash distinguishes between the version that is installed and the version that should be installed.
This is managed through:
– a release catalog
– golden images per train
– critical versions that must always be highlighted
That creates a meaningful compliance model:
– on the approved target
– one release behind
– significantly behind
– on a critical version
This is especially useful in larger environments where patching is based on approved target releases rather than simply “latest available”.
—
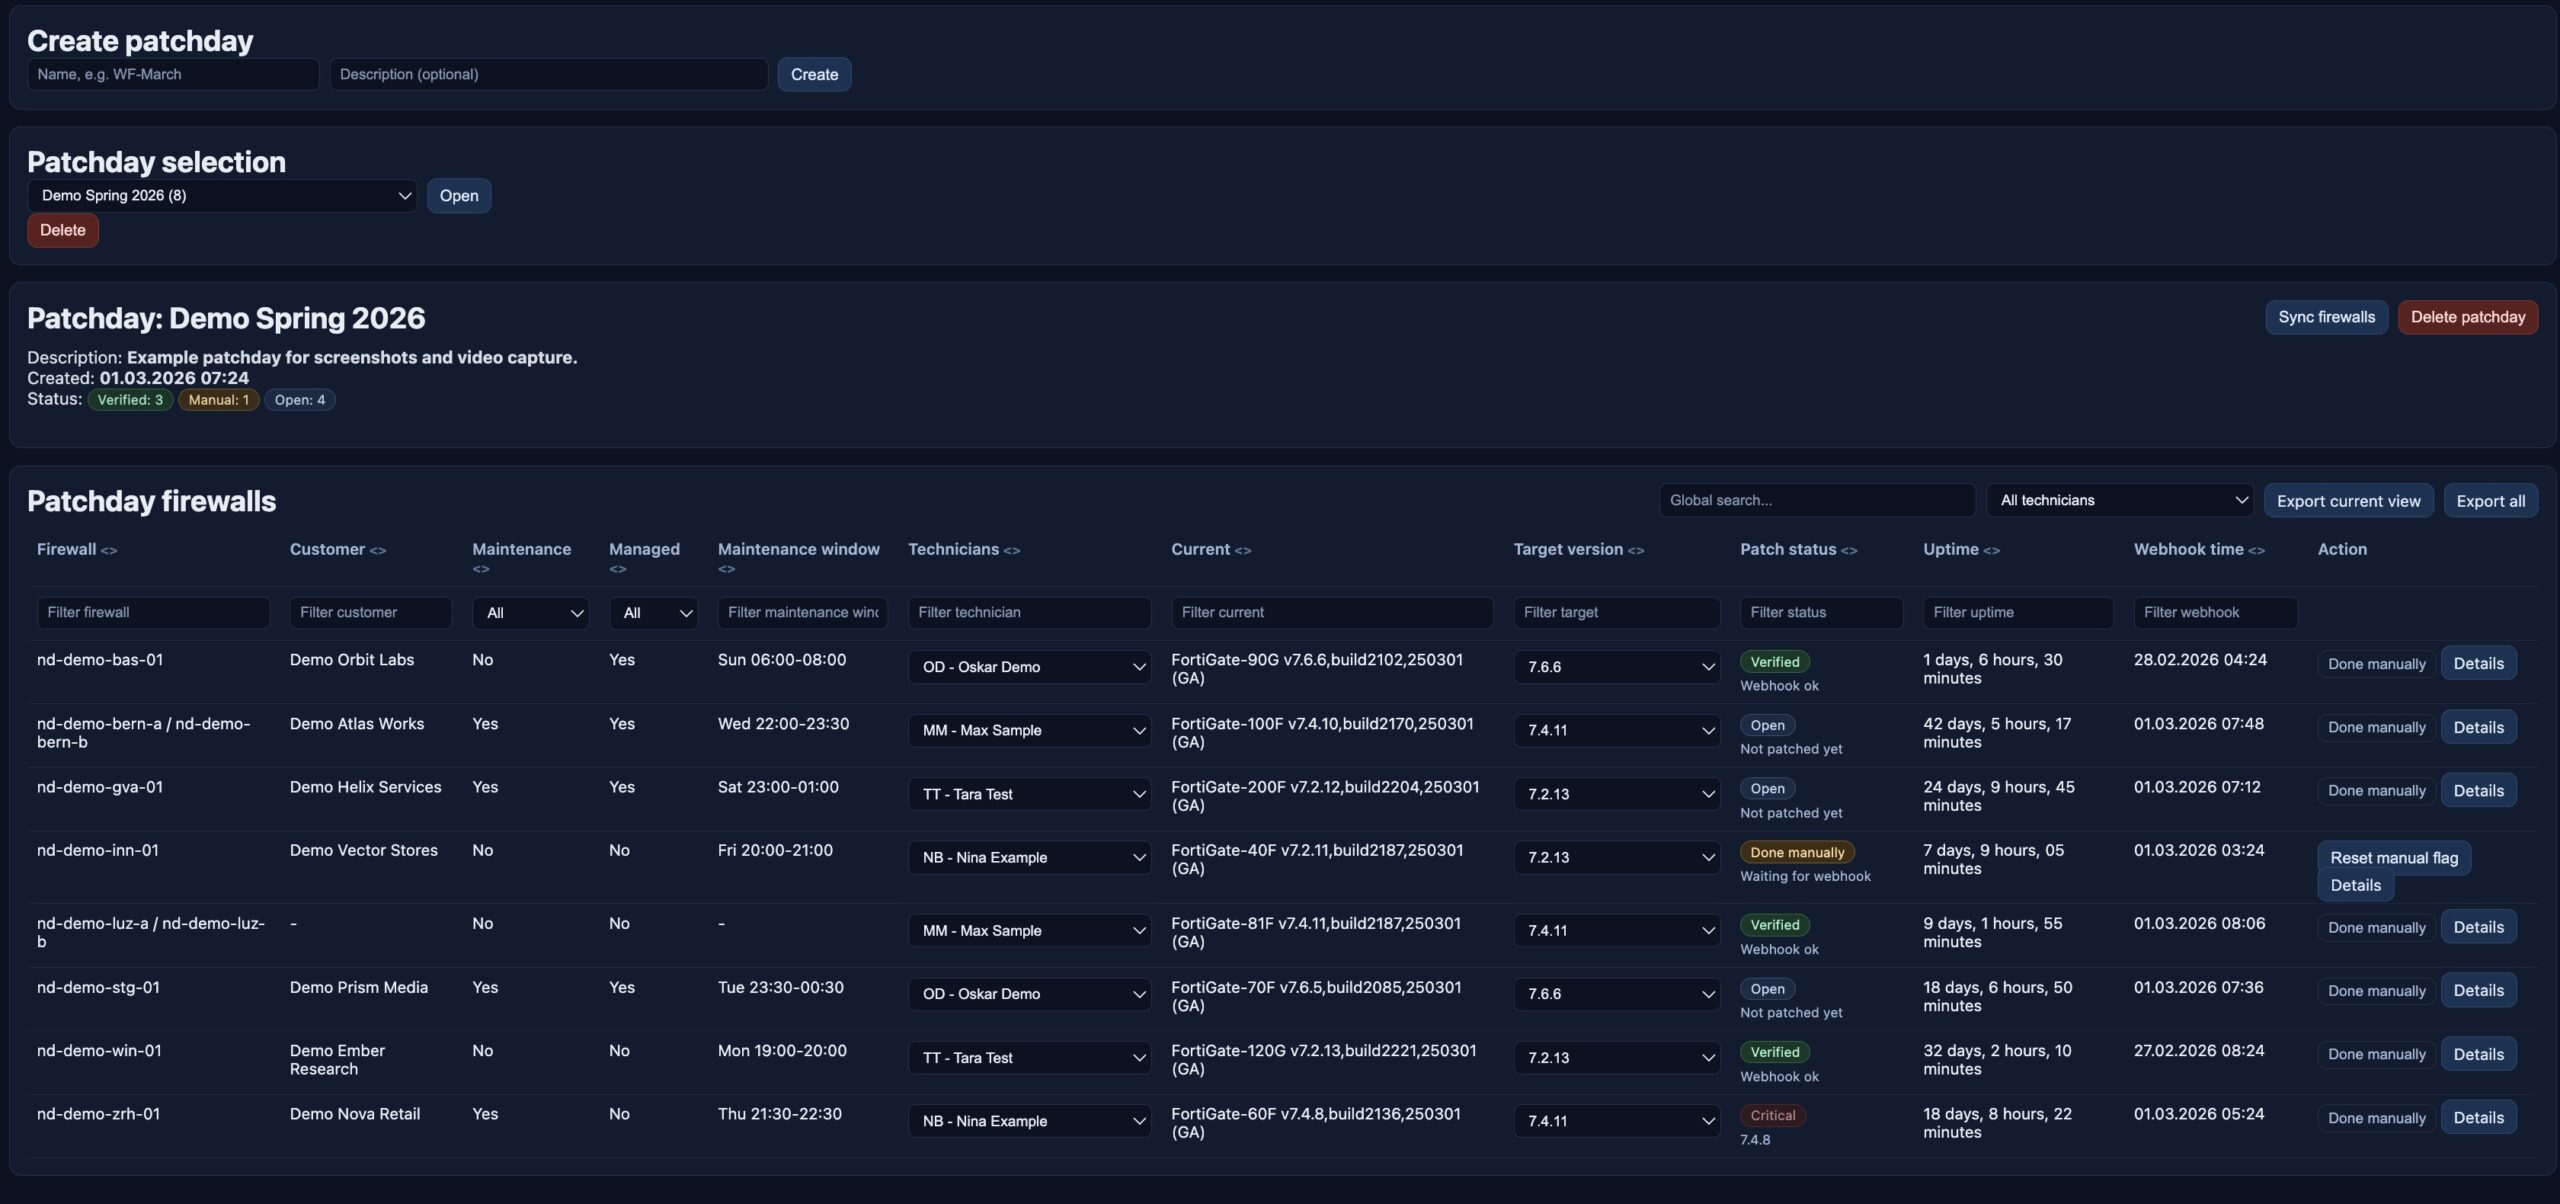
## 7. Patchday: From Target Version to Execution Tracking
Patchday is one of the most operationally relevant parts of Netdash.
It turns release policy into an execution workflow:
– create a patchday
– sync in the relevant firewalls
– assign technicians
– define target versions
– track manual progress
– verify completion through incoming webhook data
– export the current view or the full dataset
Patchday status is easy to understand:
– **Verified**: the device has reported the expected version
– **Done manually**: work was completed manually but has not yet been confirmed by webhook data
– **Open**: the task is still pending
This closes the gap between planning and verification. Patch progress is not just documented, it is measured.
—
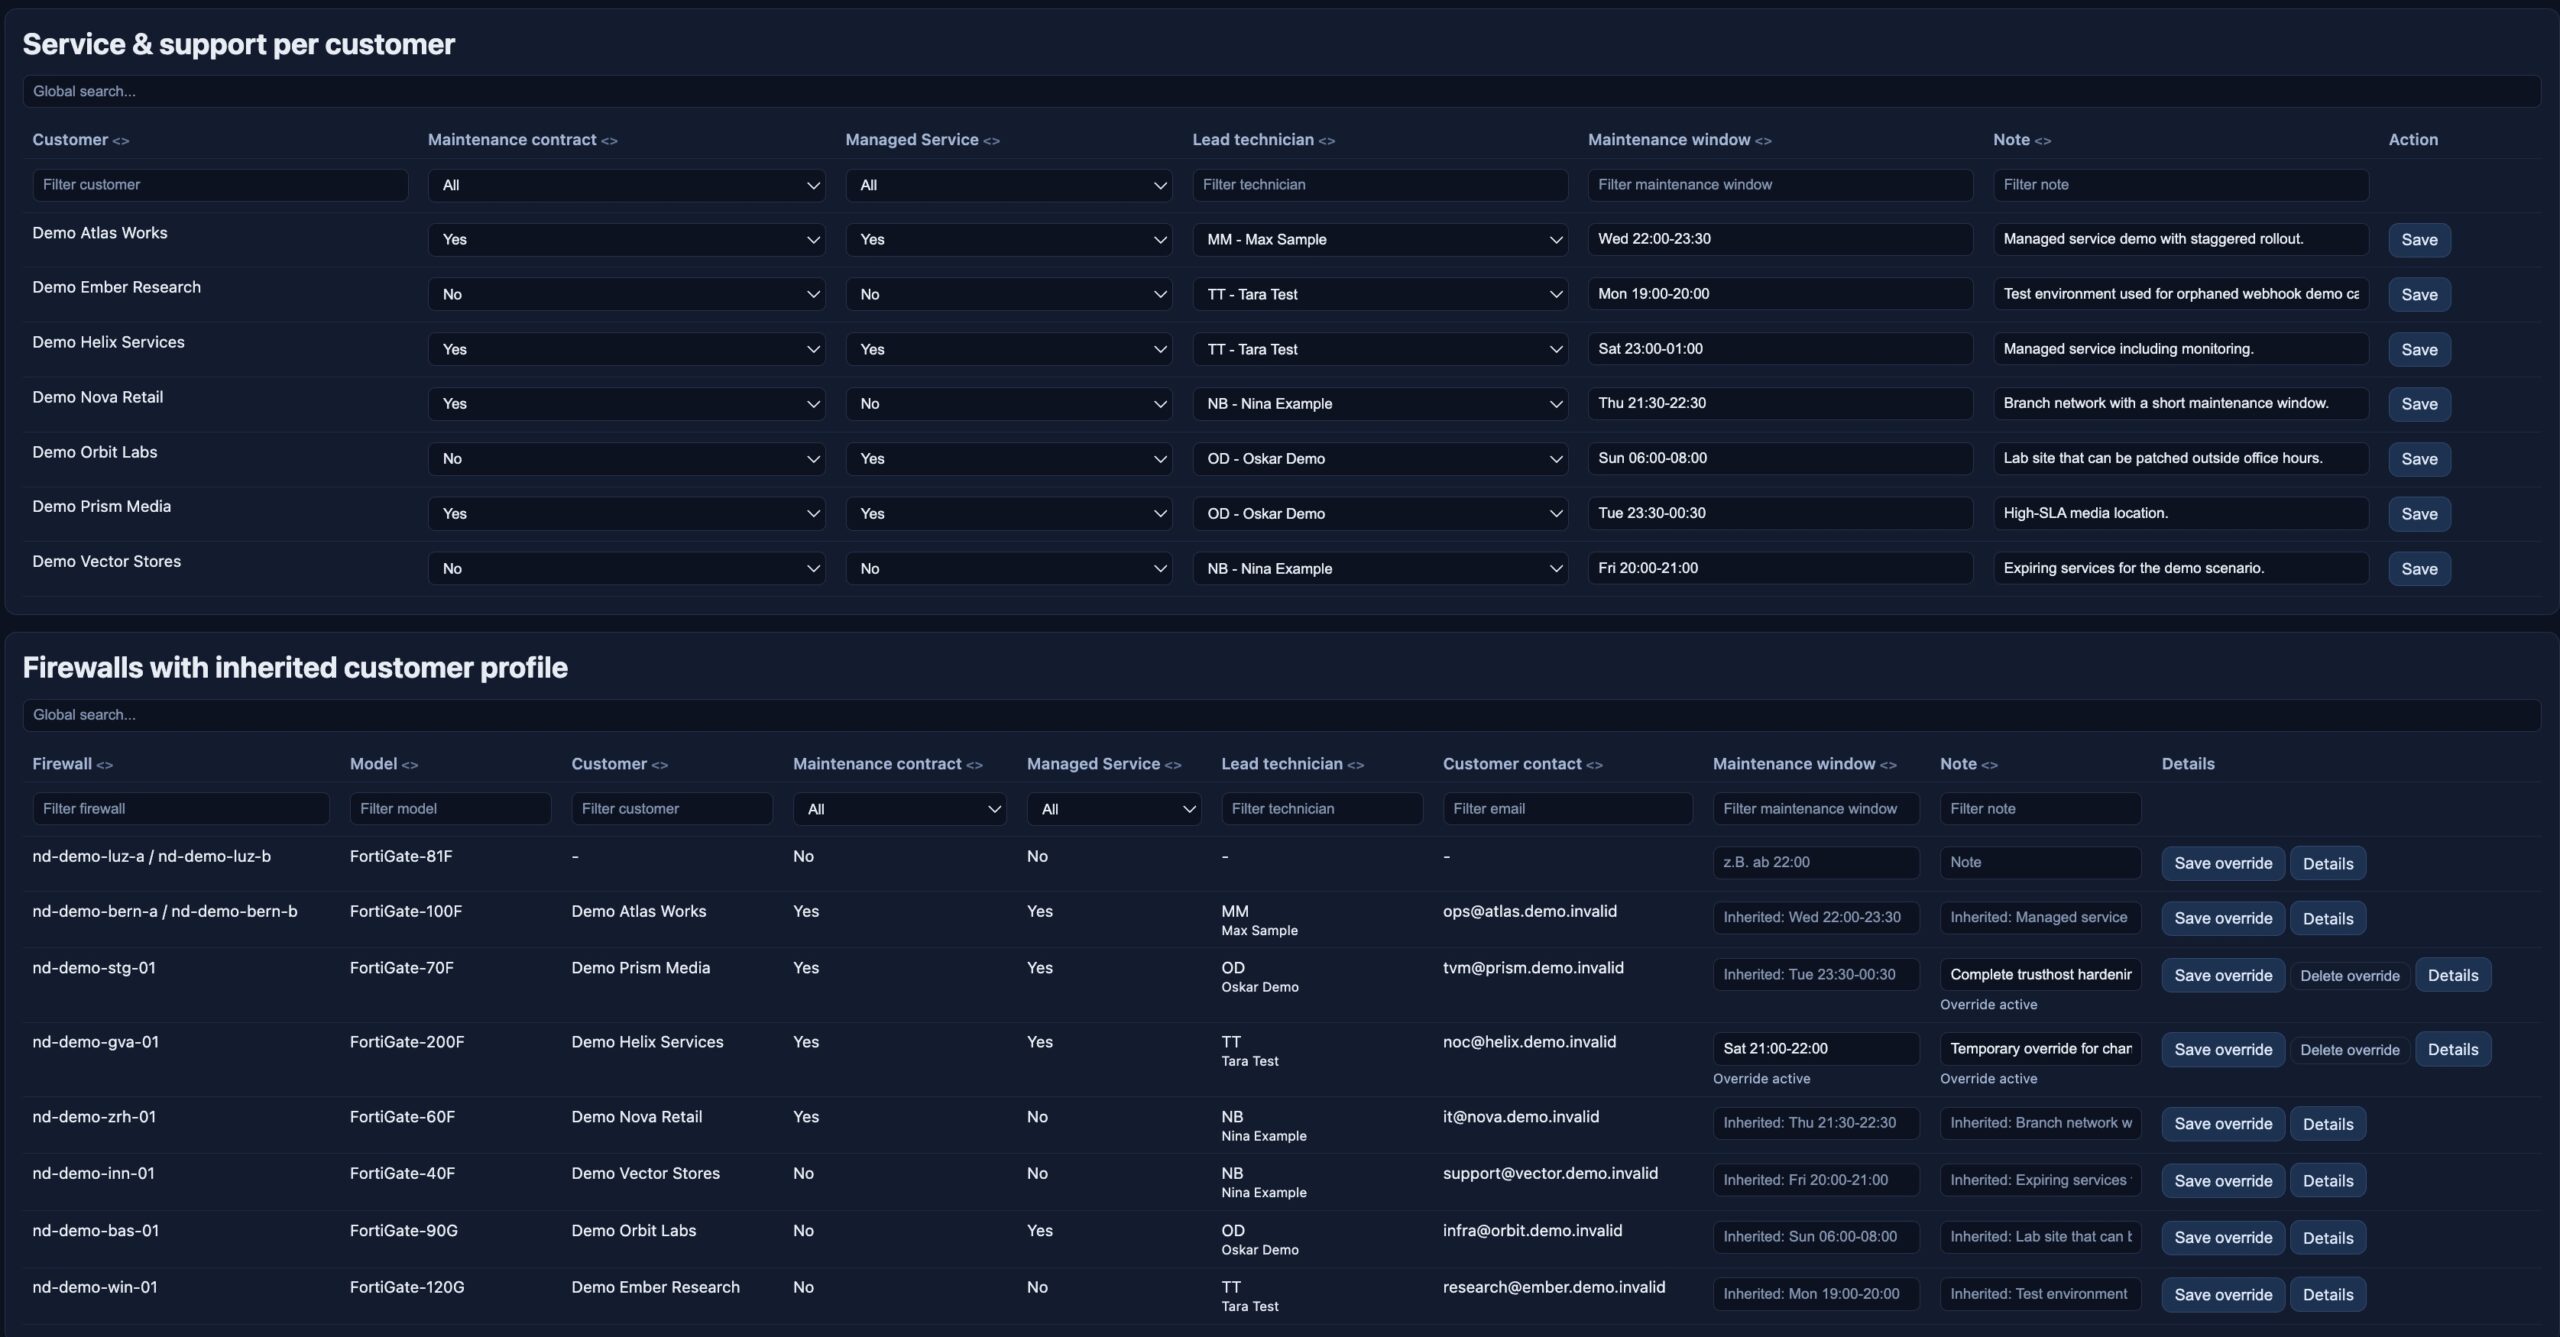
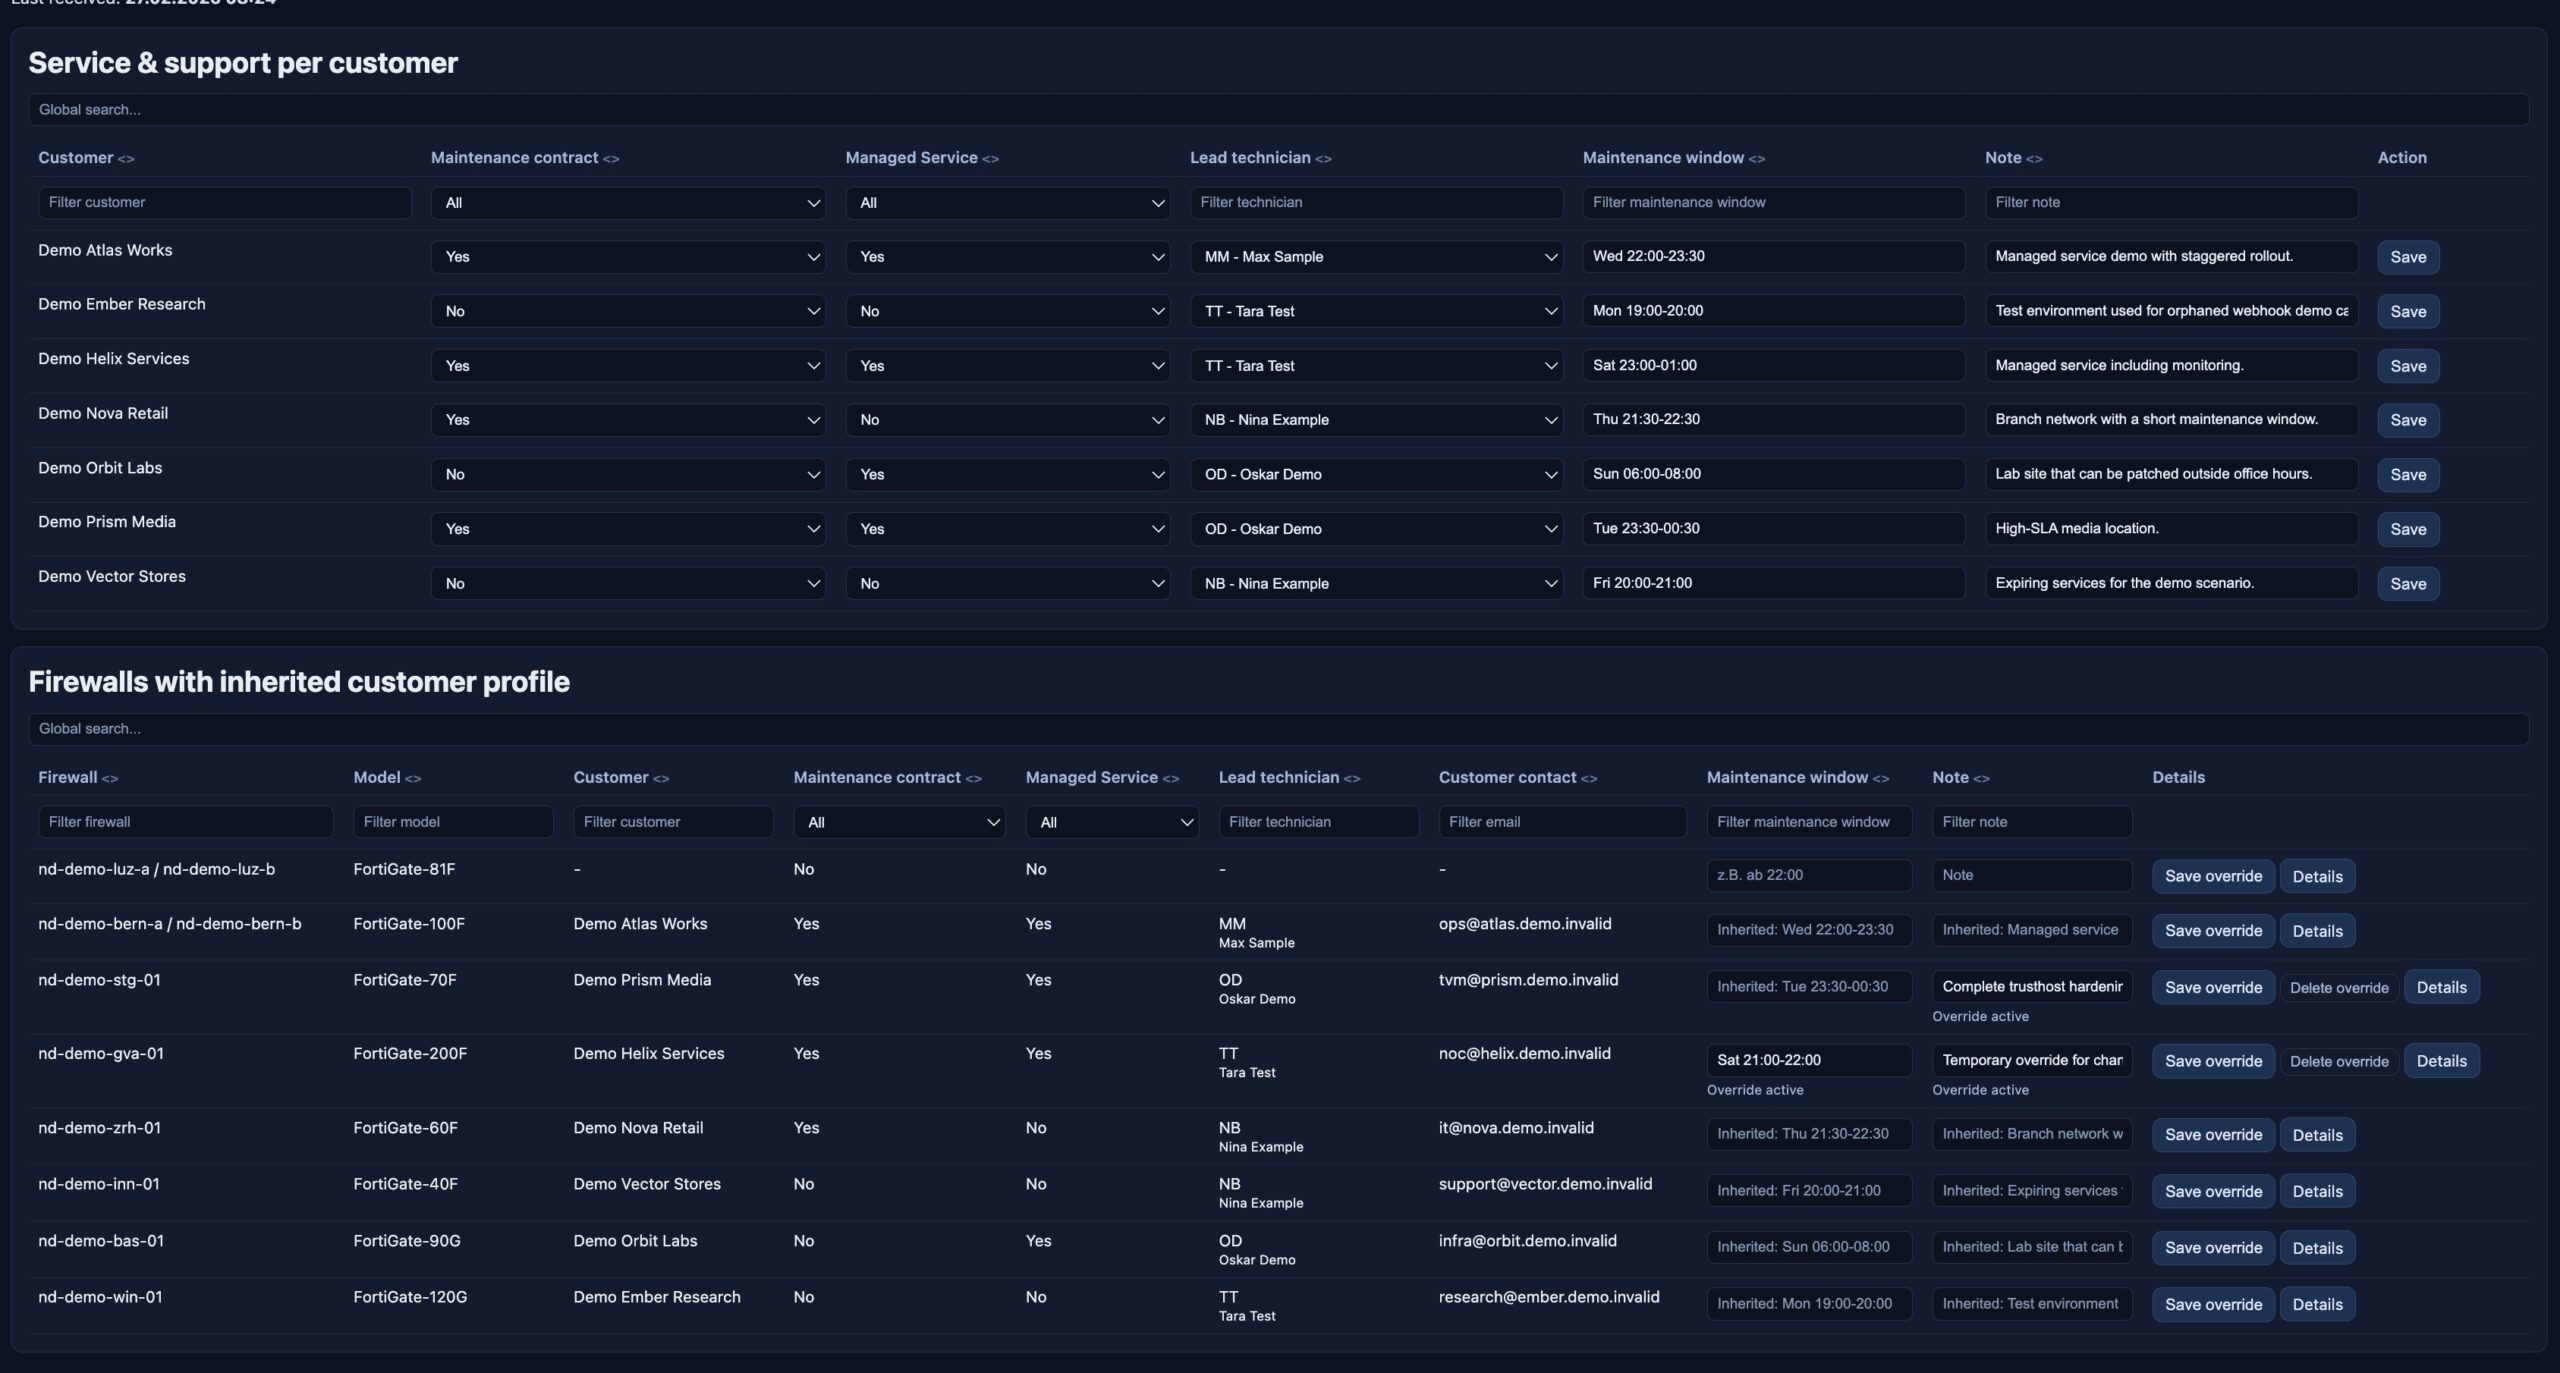
## 8. Service & Support: Operational Context per Customer
Netdash also manages the operational profile behind each customer relationship.
The Service & Support area includes:
– maintenance contract status
– managed service status
– lead technician
– maintenance windows
– notes
– unit-level overrides
This makes the platform more useful in real operations. Technical decisions usually depend on business context:
– Is after-hours work allowed?
– Is the customer fully managed?
– Who owns the follow-up?
– Does this location have special patch timing constraints?
Netdash keeps that context directly attached to the affected systems.
—
## 9. Customer and Technician Management
The demo includes the full master-data layer as well.
### Customer Management
Each customer record can include:
– customer name
– contact person
– address
– phone number
– email address
– logo
– direct access to webhook configuration
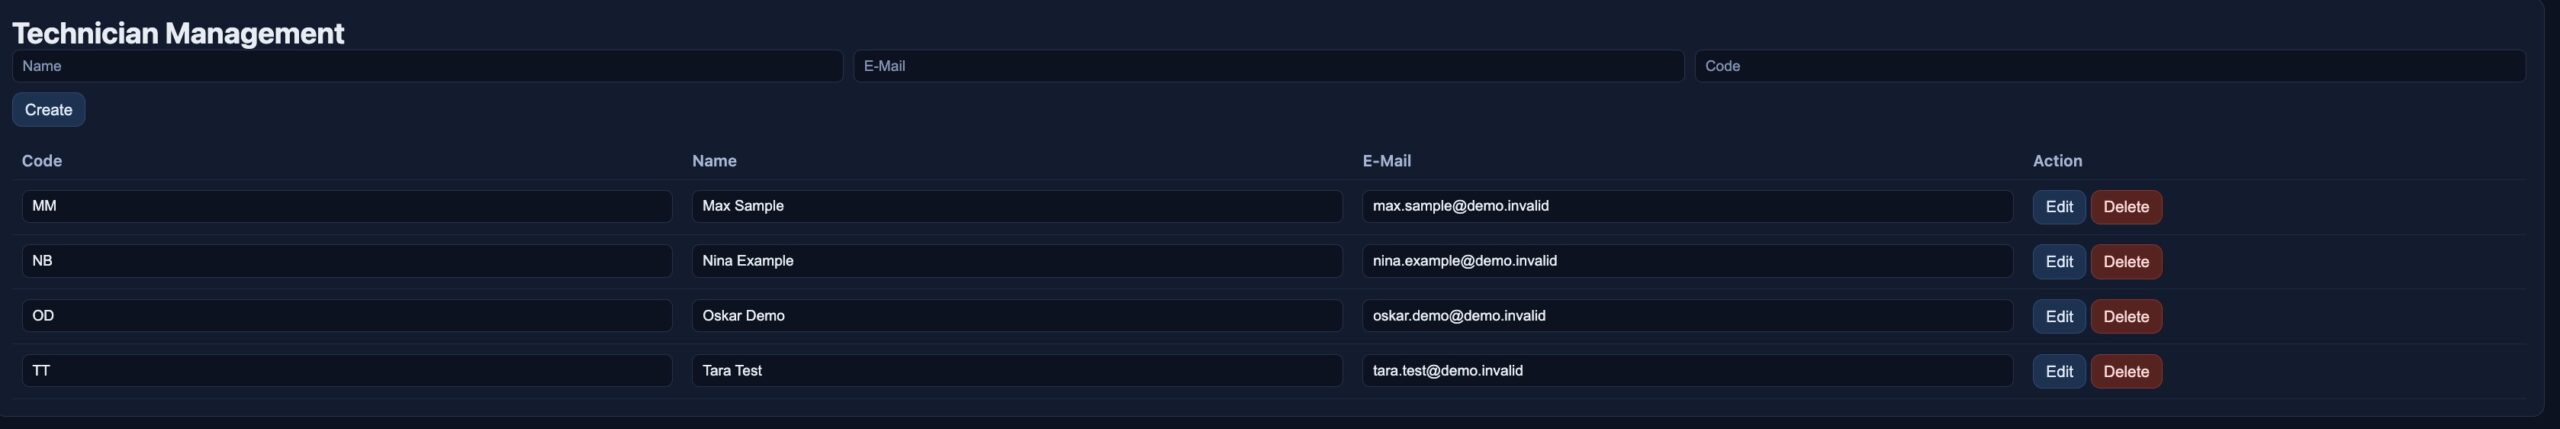
### Technician Management
Technician records include:
– name
– email
– short code
These records feed directly into Patchday and Service & Support, which keeps responsibility assignment consistent across the application.
—
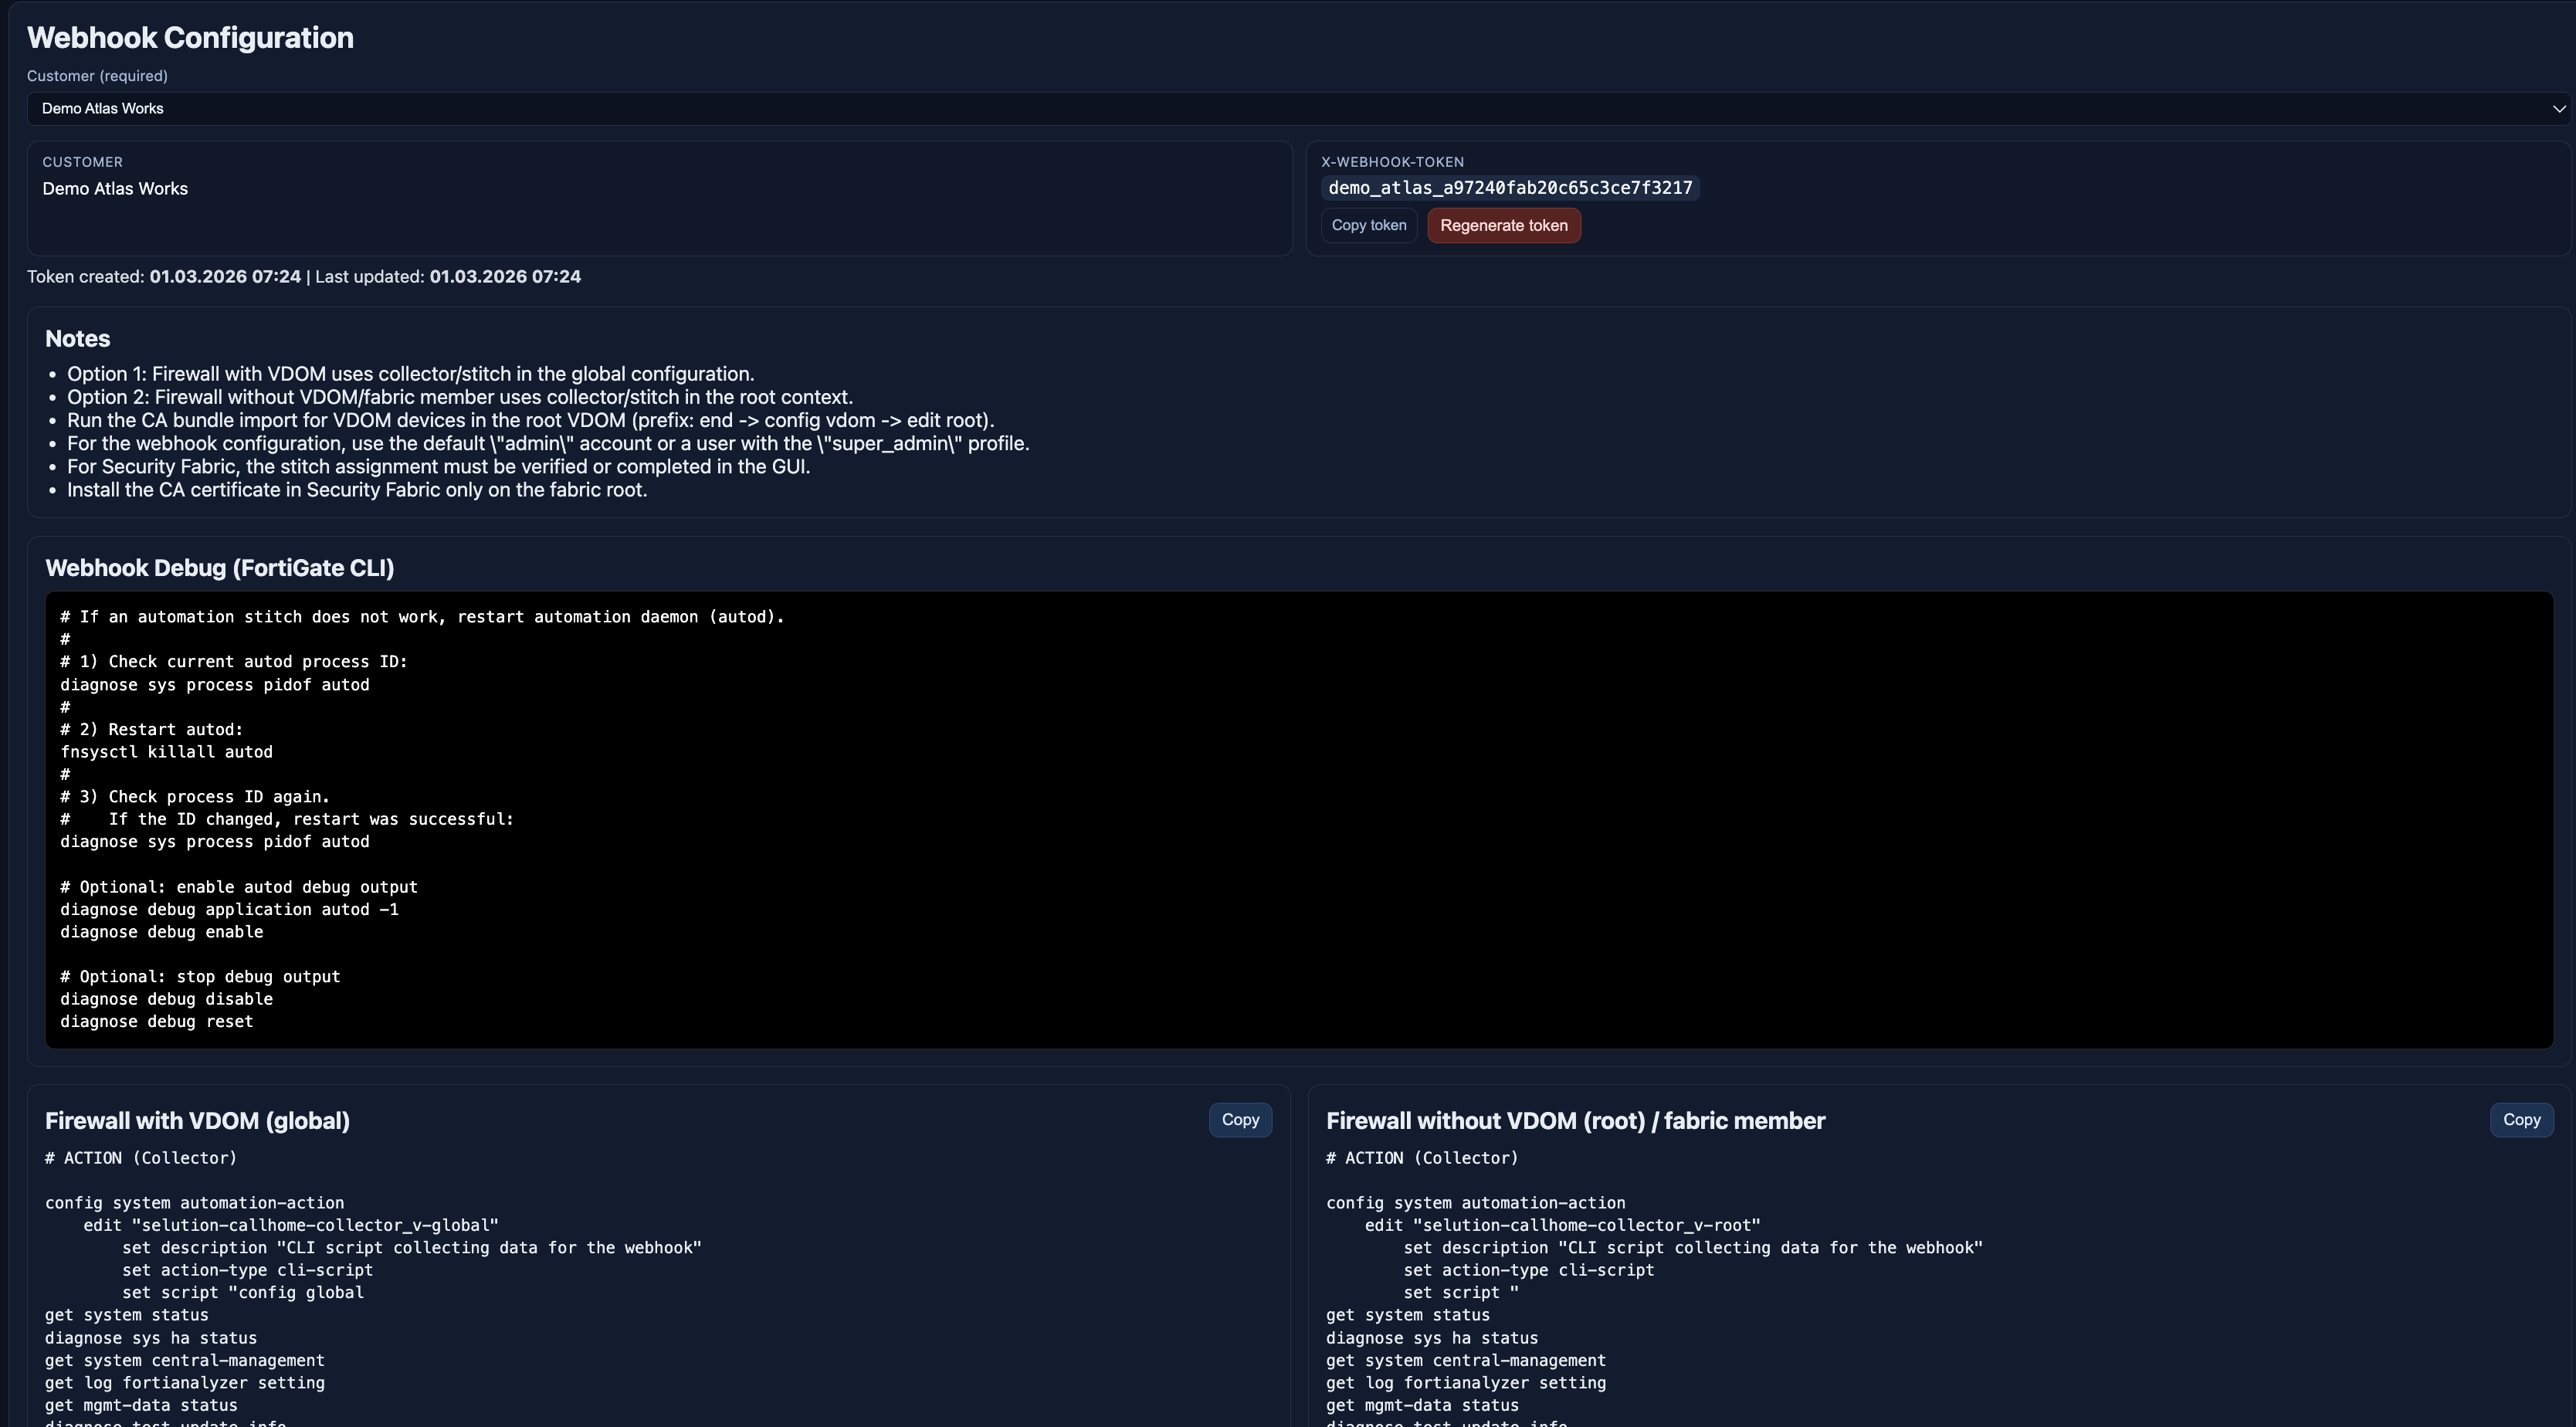
## 10. Webhooks: Configuration as Part of Operations
The webhook page is not just documentation. It actively generates the customer-specific configuration required on the firewall side.
Per customer, Netdash provides:
– a dedicated webhook token
– CLI configuration blocks
– collector definitions
– triggers
– webhook actions
– automation stitches
– reboot-related stitches
– CA bundle import guidance
This reduces rollout friction and makes the webhook setup reproducible.
### Demo-safe example
The following example uses demo values only:
```textCustomer: Demo Atlas WorksHostname: nd-demo-bern-aWebhook endpoint: https://demo-webhook.invalid/webhookX-Webhook-Token: demo_atlas_xxxxxxxxxxxxxxxxxxxxxxxx```
Example request:
```httpPOST /webhook HTTP/1.1Host: demo-webhook.invalidContent-Type: application/jsonX-Webhook-Token: demo_atlas_xxxxxxxxxxxxxxxxxxxxxxxx```
Example device payload context shown in the demo:
```textHostname: nd-demo-bern-aSerial-Number: DEMOBERN7401Version: FortiGate-100F v7.4.10Source IP: 198.51.100.11```
# ACTION (Collector)

config system automation-action
    edit "callhome-collector_v-global"
        set description "CLI script collecting data for the webhook"
        set action-type cli-script
        set script "config global
get system status
diagnose sys ha status
get system central-management
get log fortianalyzer setting
get mgmt-data status
diagnose test update info
get sys perf status | grep Uptime
show system sso-admin
show system admin | grep -v \'ENC\'"
        set accprofile "super_admin"
    next
end

# TRIGGER

config system automation-trigger
    edit "daily"
        set trigger-type scheduled
    next
end

# ACTION (Webhook)

config system automation-action
    edit "callhome-webhook"
        set description "HTTPS Webhook sendet verschluesselt daten Demo endpoint"
        set action-type webhook
        set protocol https
        set uri "demo-webhook.invalid/webhook"
        set http-body "%%results%%"
        set port 443
        config http-headers
            edit 1
                set key "Content-Type"
                set value "application/json"
            next
            edit 2
                set key "X-Webhook-Token"
                set value "demo_helix_d01caf1dbd0e5fa3f2ceb0ba"
            next
        end
    next
end


# STITCH

config system automation-stitch
    edit "secure-callhome_v-global"
        set trigger "daily"
        config actions
            edit 1
                set action "callhome-collector_v-global"
                set required enable
            next
            edit 2
                set action "callhome-webhook"
                set required enable
            next
        end
    next
end

# STITCH (Reboot)

config system automation-stitch
    edit "secure-callhome_v-gloabl-r"
        set trigger "Reboot"
        config actions
            edit 1
                set action "callhome-collector_v-root"
                set required enable
            next
            edit 2
                set action "callhome-webhook"
                set required enable
            next
        end
    next
end

# CA Bundle Import

end
config vdom
edit root
config vpn certificate ca
edit "Sectigo Public Server Authentication CA DV R36"
set ca "-----BEGIN CERTIFICATE-----
MIIGTDCCBDSgAwIBAgIQOXpmzCdWNi4NqofKbqvjsTANBgkqhkiG9w0BAQwFADBf
MQswCQYDVQQGEwJHQjEYMBYGA1UEChMPU2VjdGlnbyBMaW1pdGVkMTYwNAYDVQQ
...
—
## 11. Troubleshoot: Visibility into the Public Webhook Interface
The Troubleshoot page gives operators direct visibility into what is happening on the public webhook ingress side.
Requests are categorized by severity:
– **green**: valid webhook accepted
– **orange**: token invalid, but the payload looks firewall-like
– **red**: malformed request, scanner traffic or unrelated noise
The page supports filtering by:
– global search
– source IP
– customer or hostname
– severity
For orange and red events, operators can inspect additional detail such as:
– headers
– content type
– user agent
– body excerpt
This turns the public interface into an observable surface rather than a blind ingest endpoint.
### Demo-safe troubleshooting examples
```textAccepted request:- Source IP: 198.51.100.11- Hostname: nd-demo-bern-a- Customer: Demo Atlas Works- Result: green / accepted```
```textSuspicious request:- Source IP: 198.51.100.250- Hostname: -- Token hint: scanner-probe- Result: red / invalid request```
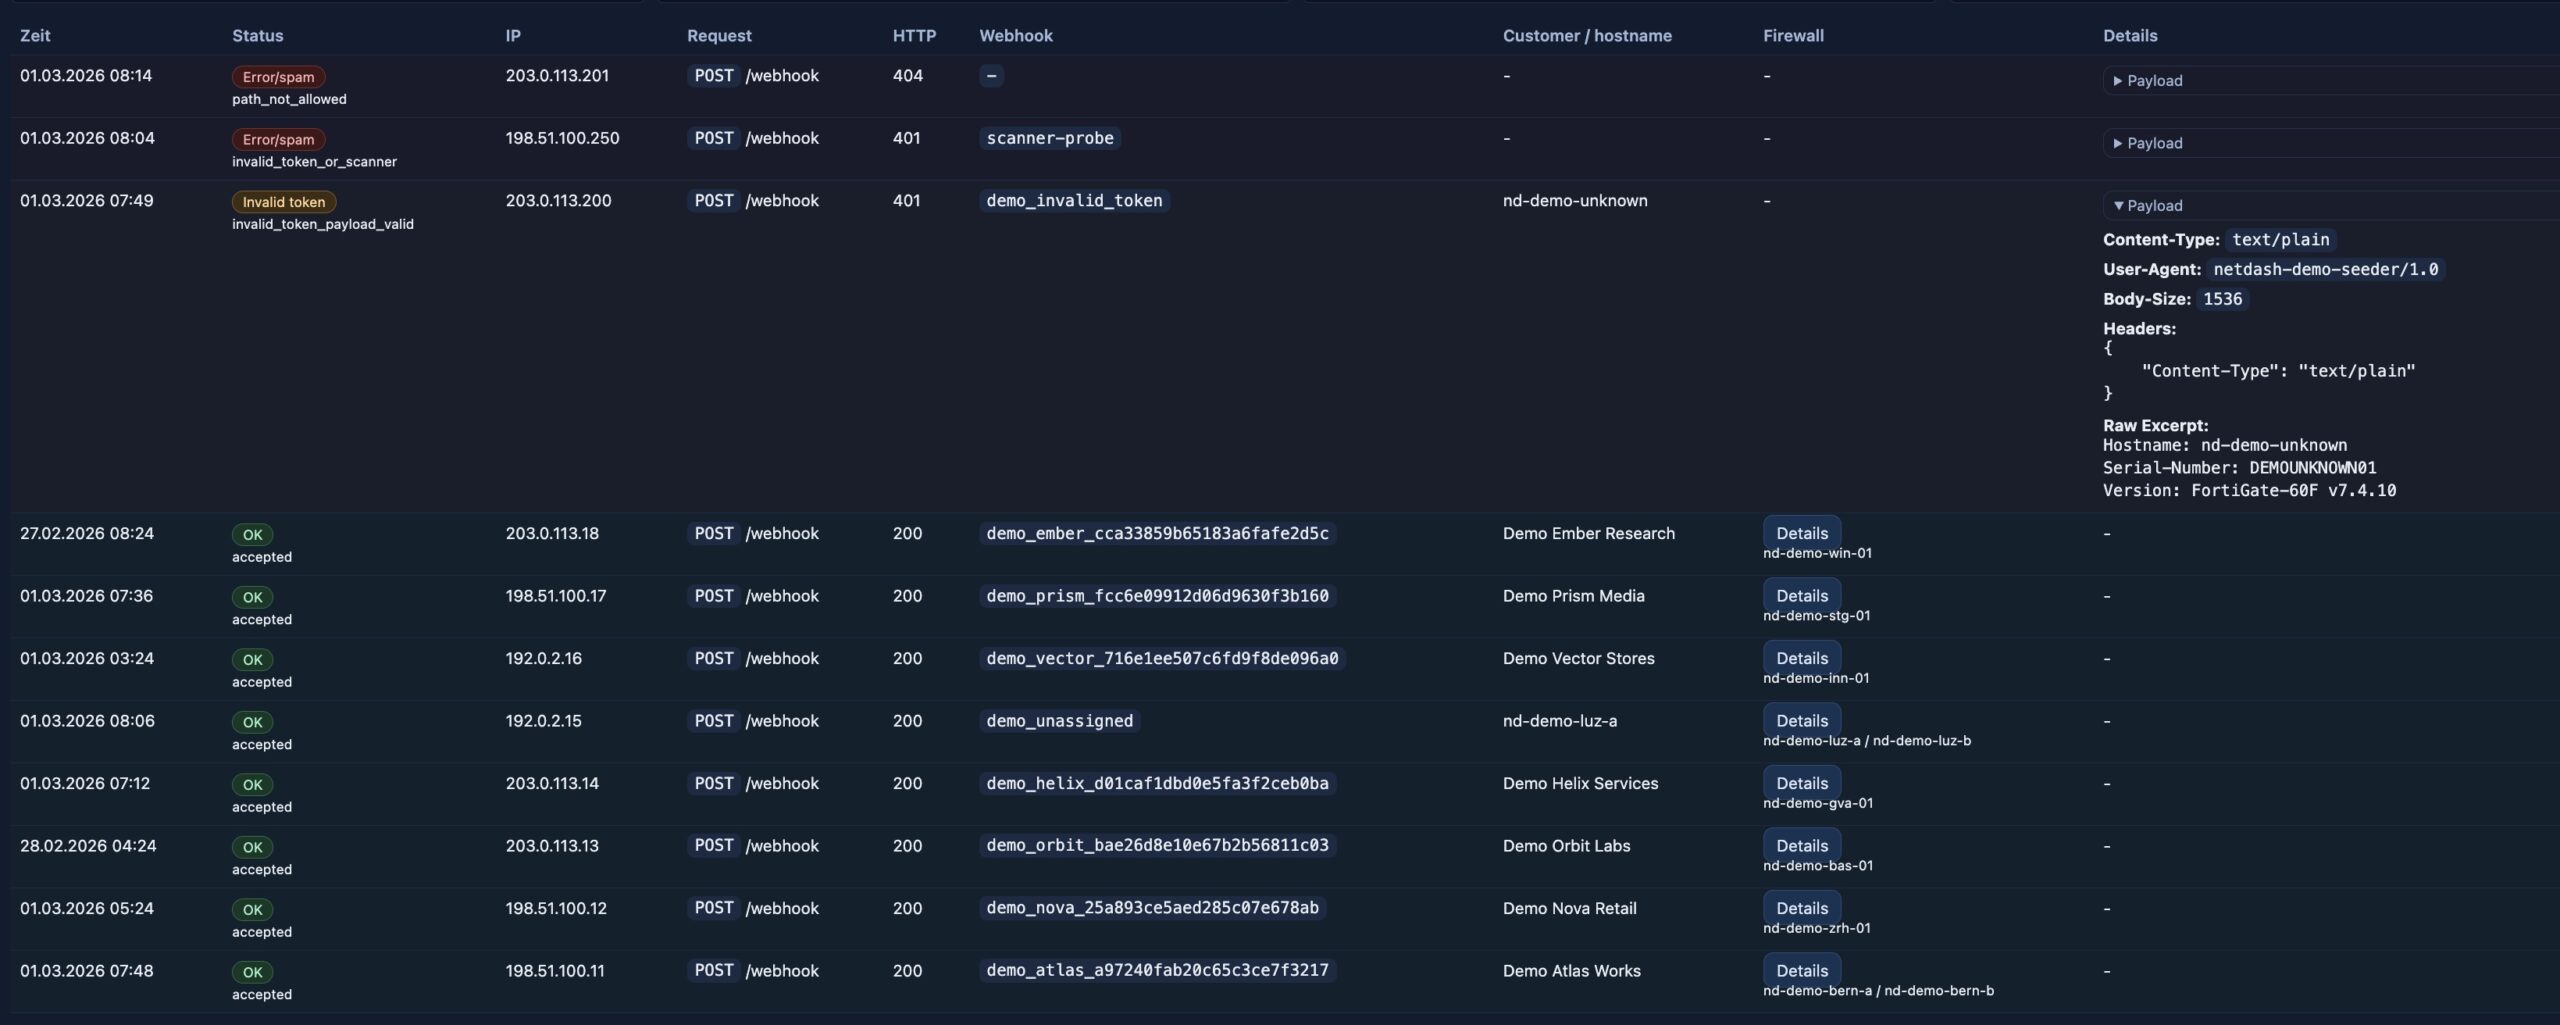
It’s purpose is mainly to track misconfiguration and malicious activity.
—
## 12. Database Model
In production, Netdash uses a local PostgreSQL database on the server. In the demo, the application runs against a separate SQLite database populated with synthetic records. The functional model is the same: technical state, ownership context and process tracking all live in one structured dataset.
Core tables include:
### Inventory and device state
– `firewall_units`
– `firewall_members`
– `snapshots`
### Customer and webhook context
– `customers`
– `unit_customers`
– `customer_webhook_tokens`
– `webhook_request_logs`
### Operations and ownership
– `technicians`
– `customer_profiles`
– `unit_profile_overrides`
### Release, licensing and patch logic
– `release_catalog`
– `golden_images`
– `critical_versions`
– `patchdays`
– `patchday_units`
– `license_notes`
– `license_acknowledgements`
This matters because Netdash does not treat inventory, ownership and execution as separate systems. The database model links them directly.
—
## 13. Demo Data Instead of Production Data
For this article, every concrete example comes from the demo dataset.
That includes:
– demo hostnames such as `nd-demo-bern-a`
– demo customers such as `Demo Atlas Works`
– demo technicians such as `Max Sample` and `Nina Example`
– demo serial numbers such as `DEMOBERN7401`
– demo IP ranges such as `198.51.100.x` and `203.0.113.x`
– demo-only webhook endpoints such as `demo-webhook.invalid`
This keeps the article publishable while still showing realistic operational flows and realistic-looking data relationships.
—
## 14. Server Architecture: Private Interface vs Public Interface
One of the most important architectural aspects of Netdash is the strict separation between the private dashboard surface and the public ingest surface.
### Private interface
The private interface serves authenticated users and the operational UI, it’s only accessible from the internal network and uses MFA SSO for additional security.
Demo-safe example:
```textPrivate UI example:https://netdash.demo.local/```
Responsibilities:
– dashboard access
– operational workflows
– customer and technician management
– licensing and patchday planning
– webhook configuration
– troubleshooting UI
### Public interface
The public interface is meant for incoming device traffic only.
Demo-safe example:
```textPublic webhook example:POST https://webhook.invalid/webhook```
Responsibilities:
– receive webhook requests
– validate the token
– parse the payload
– write snapshots and metadata
– log accepted and rejected traffic
### Why the separation matters
This split keeps the attack surface small:
– the private UI is not exposed as a public webhook surface
– the public endpoint does not serve the dashboard
– routing and behavior can be hardened independently
At the application level, this is separated through two runtime modes:
– `dashboard`
– `webhook`
That makes the platform easier to secure and easier to reason about operationally.
– users -> private dashboard interface
– firewalls -> public webhook interface
– both flowing into Netdash and the database layer
—