 Download als PDF File
Introduction
Logdash is a syslog platform built to receive FortiGate event logs over Syslog TLS and turn them into operationally useful insights. The ingest layer is based on `rsyslog`, while Logdash itself is a custom frontend tailored to FortiGate-centric environments.
The design goal is deliberately narrow: collect event logs, not traffic logs. Traffic logs are far better handled by FortiAnalyzer, and pulling them into a lightweight platform would add a large amount of volume without improving the operational use cases this system is built for.
Typical event logs include:
– admin logins
– configuration changes
– unsuccessful login attempts
– VPN sessions
– SD-WAN statistics
– performance statistics
These events are compact, structured, and surprisingly rich in context. When they are correlated with the Netdash database, they become the basis for highly practical analysis across customers, firewalls, units, and sensors.
This makes several focused workflows possible:
– Audit logs: who changed what, and when
– Performance logs: CPU, memory, sessions, and setup rate over time
– SD-WAN performance: health tracking and SLA monitoring
– Bruteforce detection plus auto-blocking via IP feed
All functions are modular by design, so the same dataset can be filtered and evaluated per customer, per firewall, or per individual sensor path.
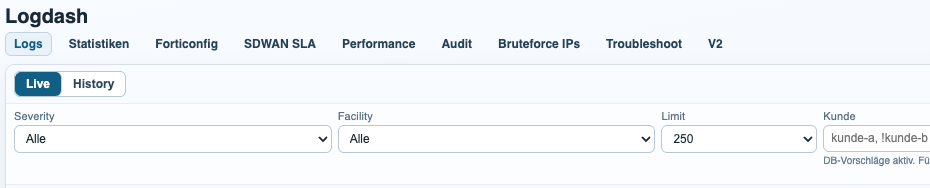
Dashboard and Filtering
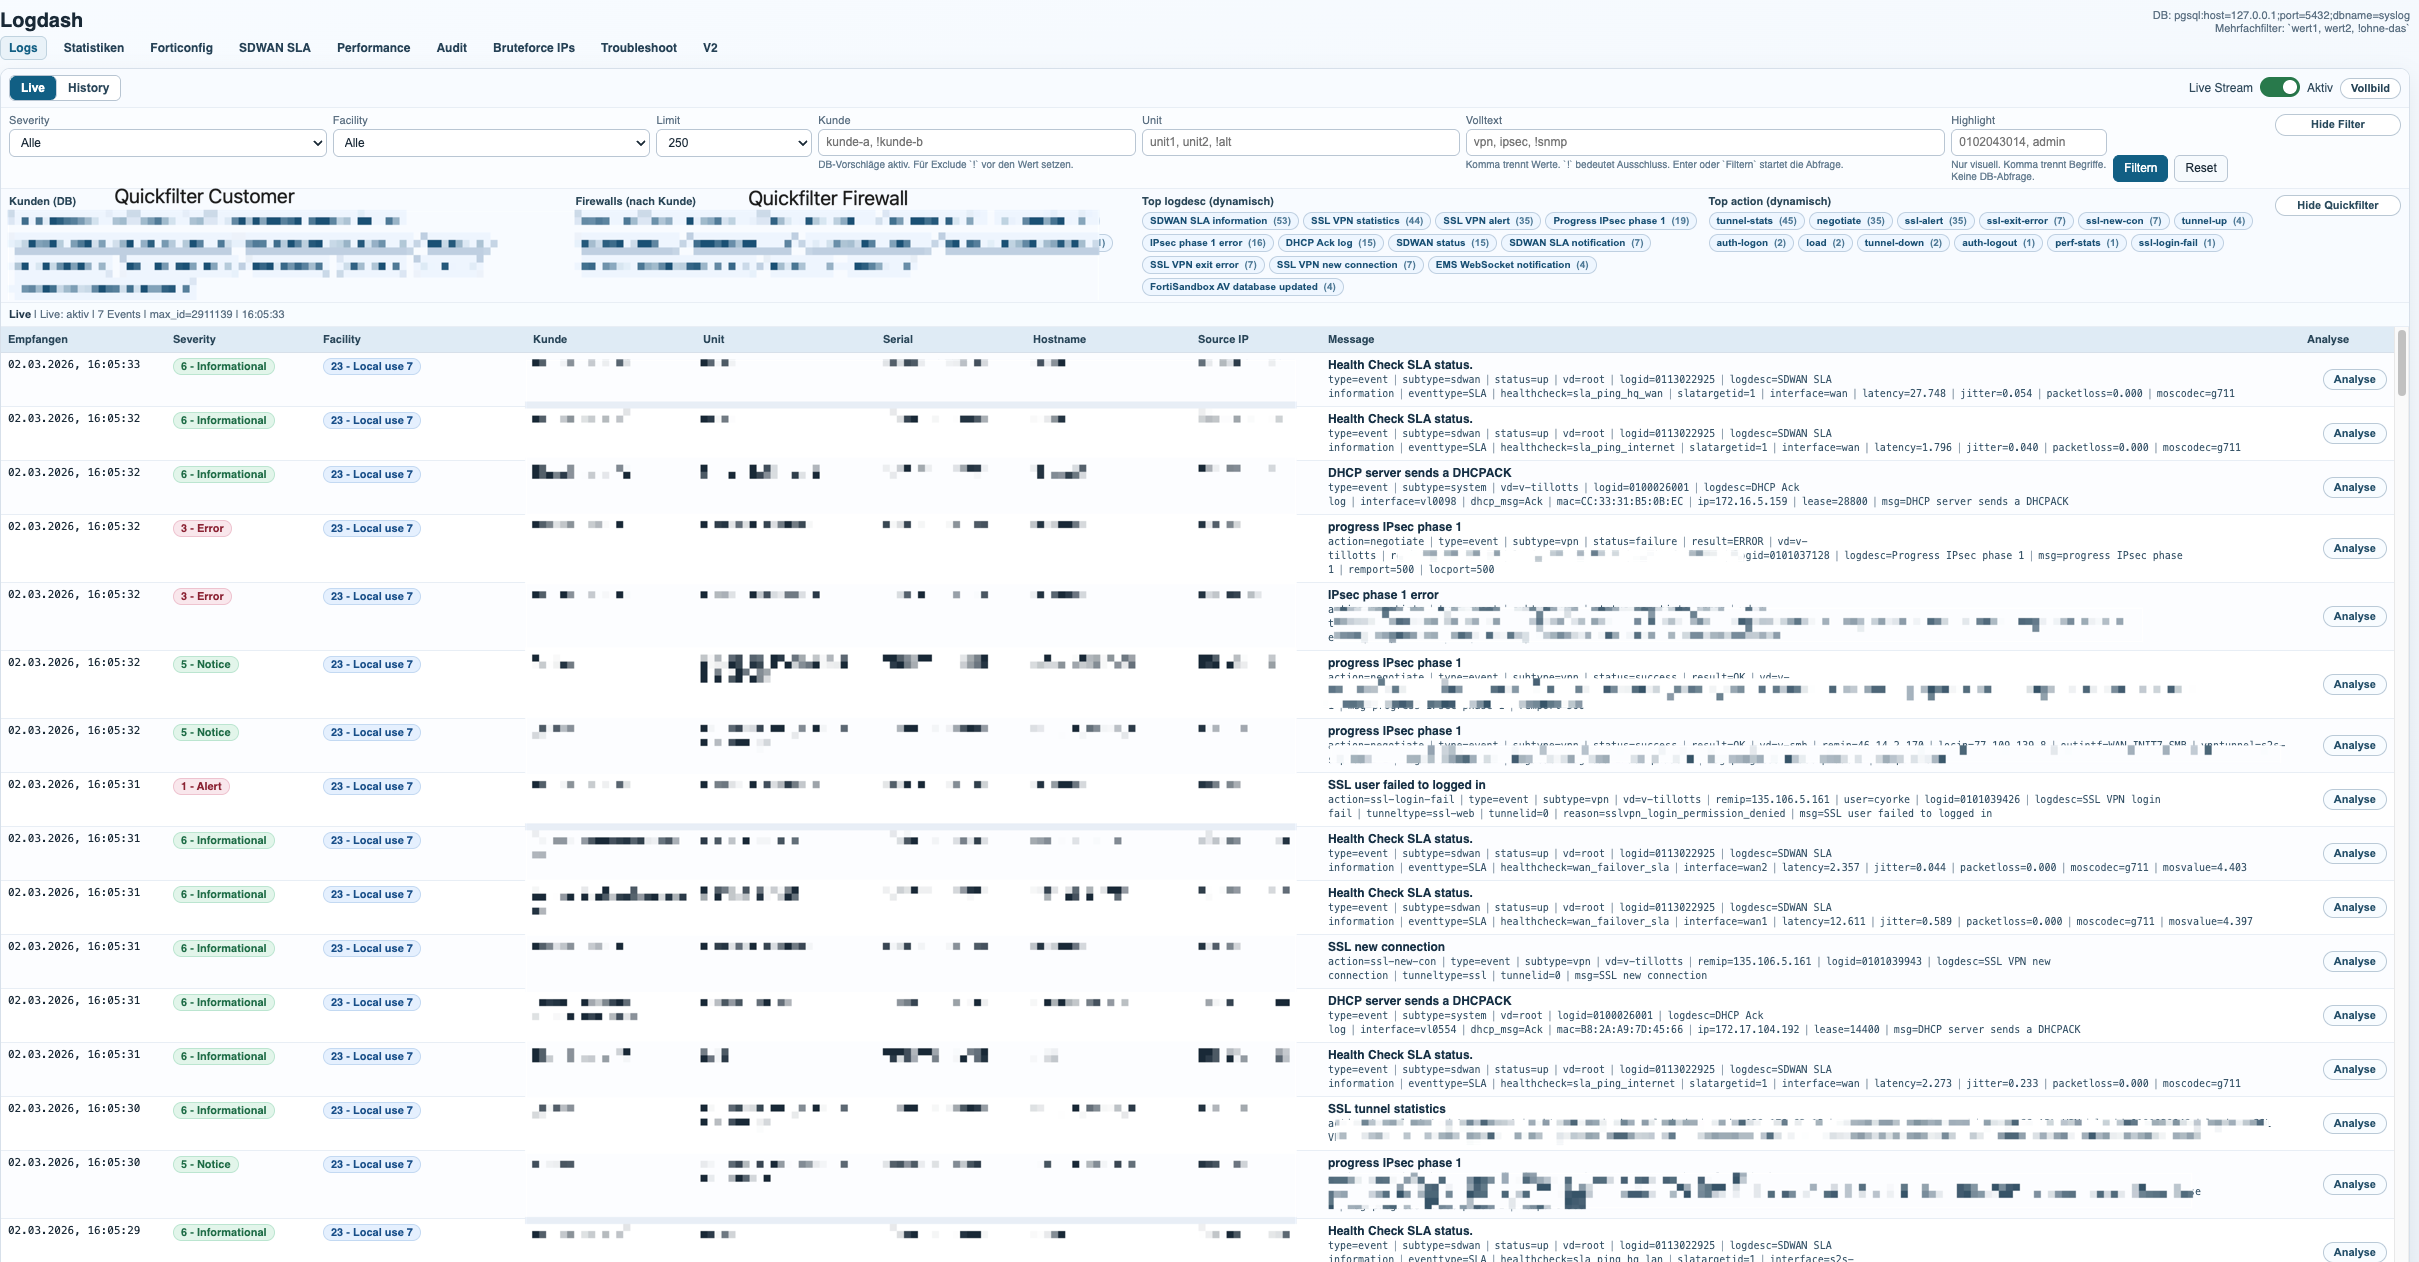
The dashboard is the main entry point into the dataset. It combines live log visibility with fast filtering, so operators can move from a broad event stream to a very specific customer, firewall, serial, hostname, severity, or time range in just a few clicks.
The frontend reads from the Logdash PostgreSQL event store and enriches the results with metadata from Netdash. That mapping layer is what turns raw serials and hostnames into customer-aware views, which is essential once multiple firewalls belong to the same customer or unit.
In practice, this means the same log platform can be used for live troubleshooting, historical review, and customer-scoped analysis without switching tools.
Audit Analysis and Reporting
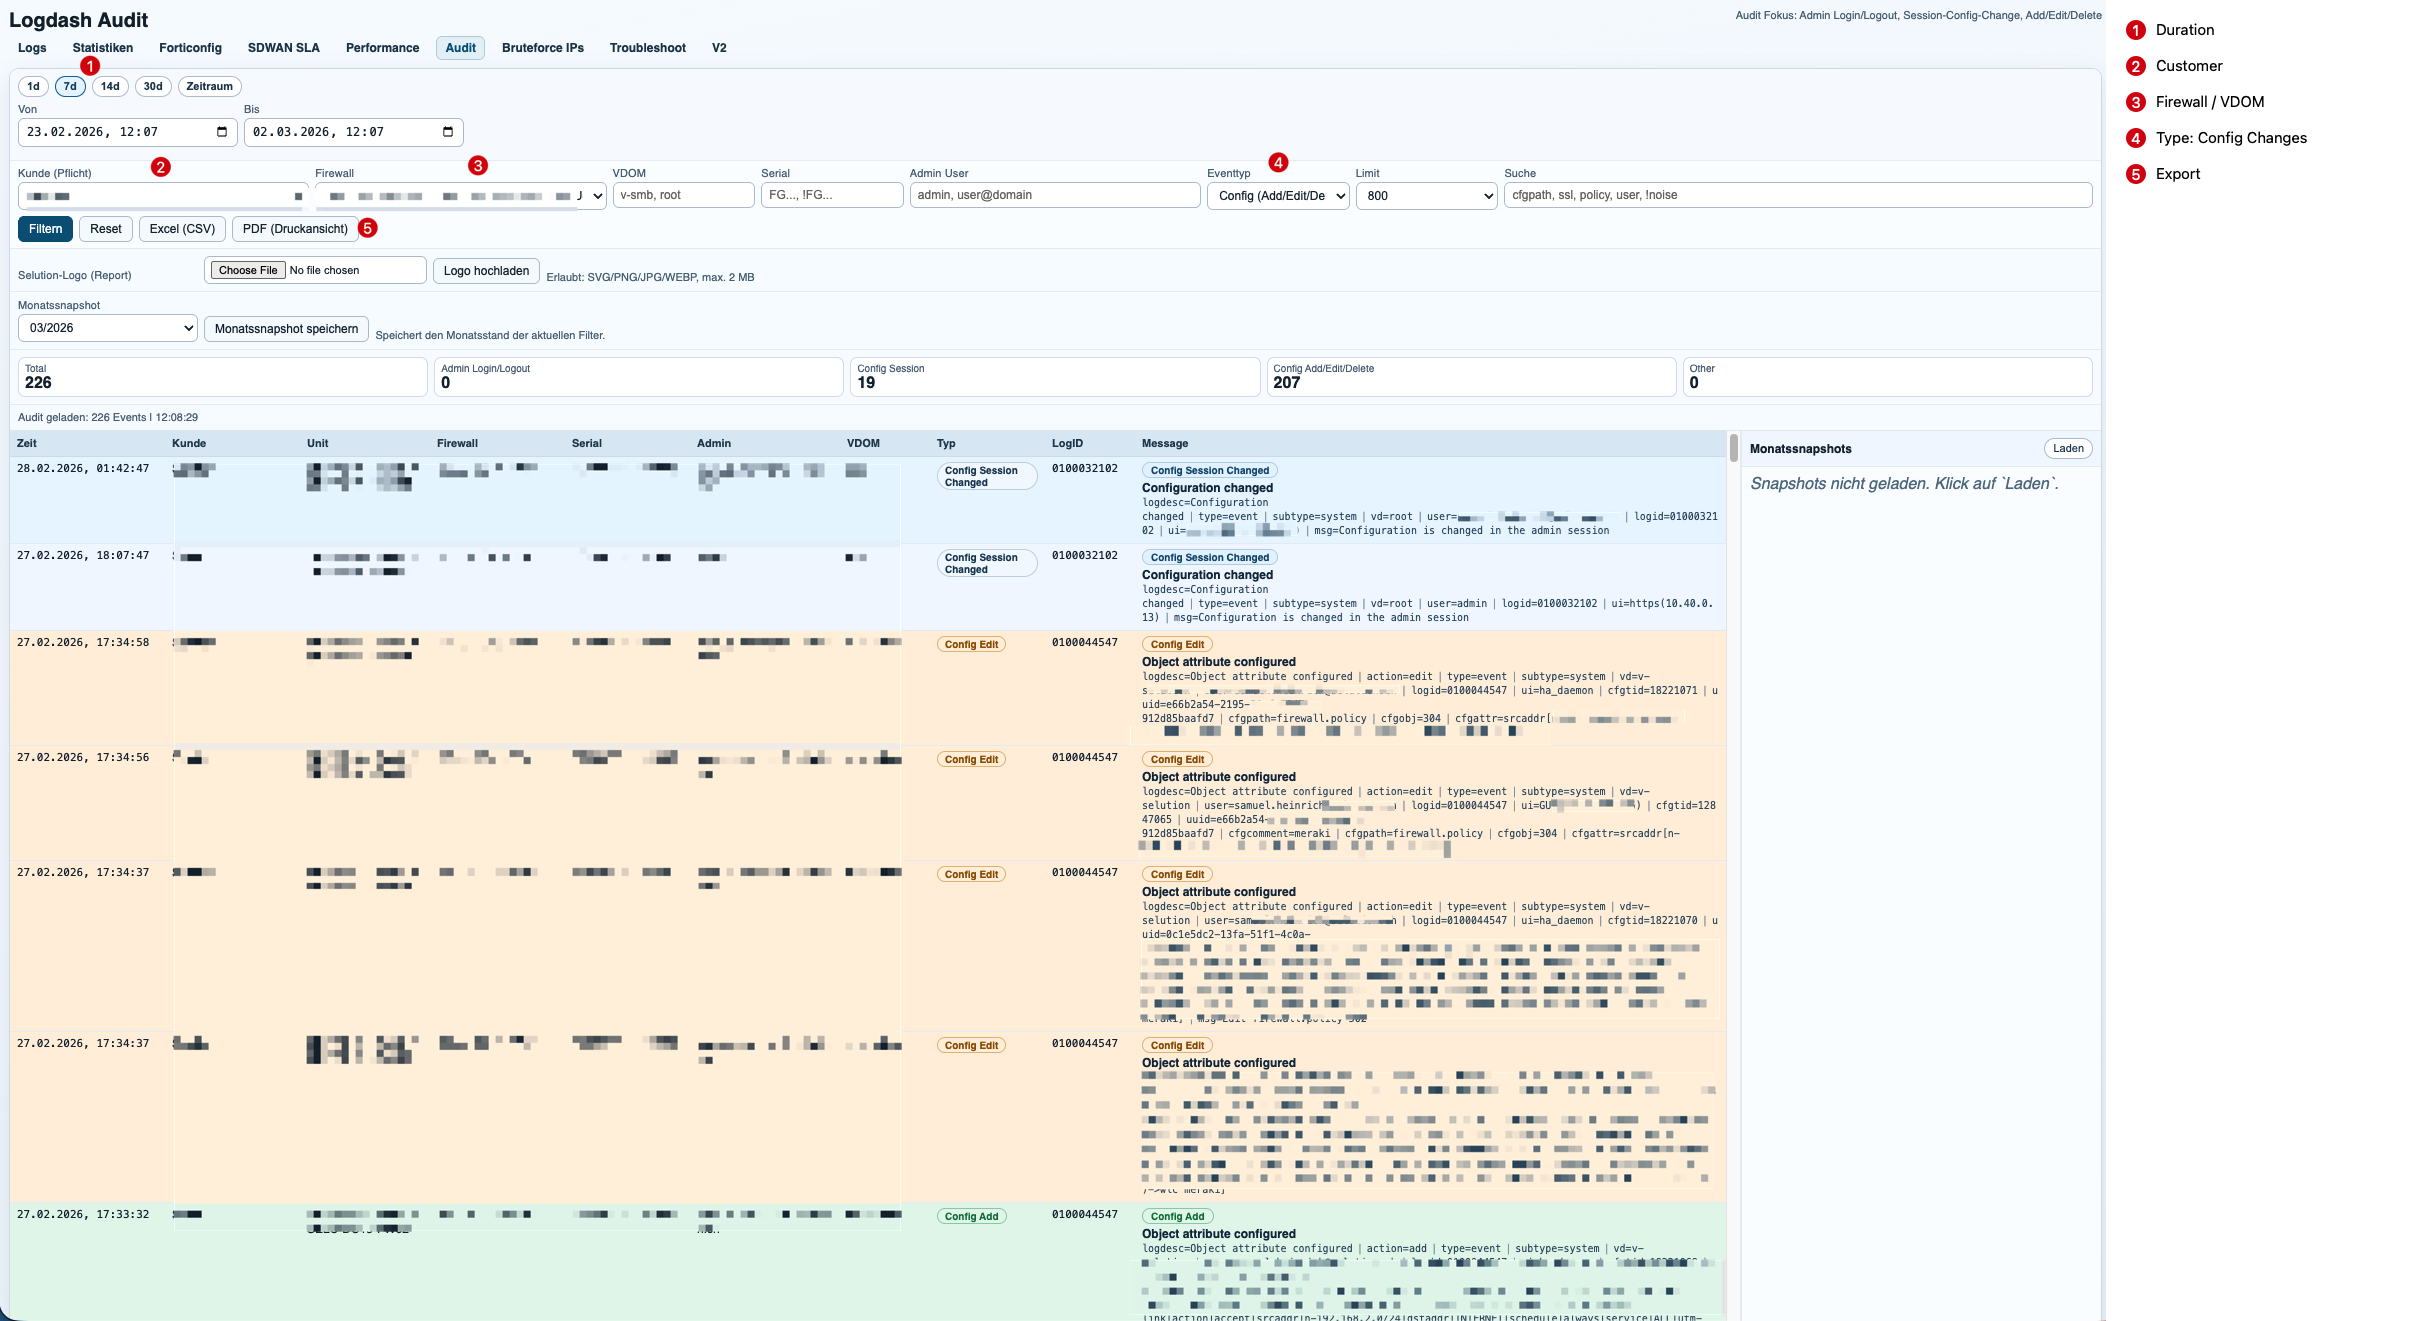
The audit module focuses on administrative activity and configuration changes. It turns raw event logs into a readable timeline that answers the questions operations teams actually ask: who logged in, which firewall was touched, which object changed, and when it happened.
Because Logdash is linked to Netdash metadata, the audit scope is not limited to a single device. A customer can have multiple assigned firewalls, and the report can consolidate the full audit trail across that environment in one view.
Reports can be generated manually for ad-hoc investigations or exported automatically for recurring review cycles. This makes the module useful both for incident response and for routine customer reporting.
SD-WAN SLA Analysis
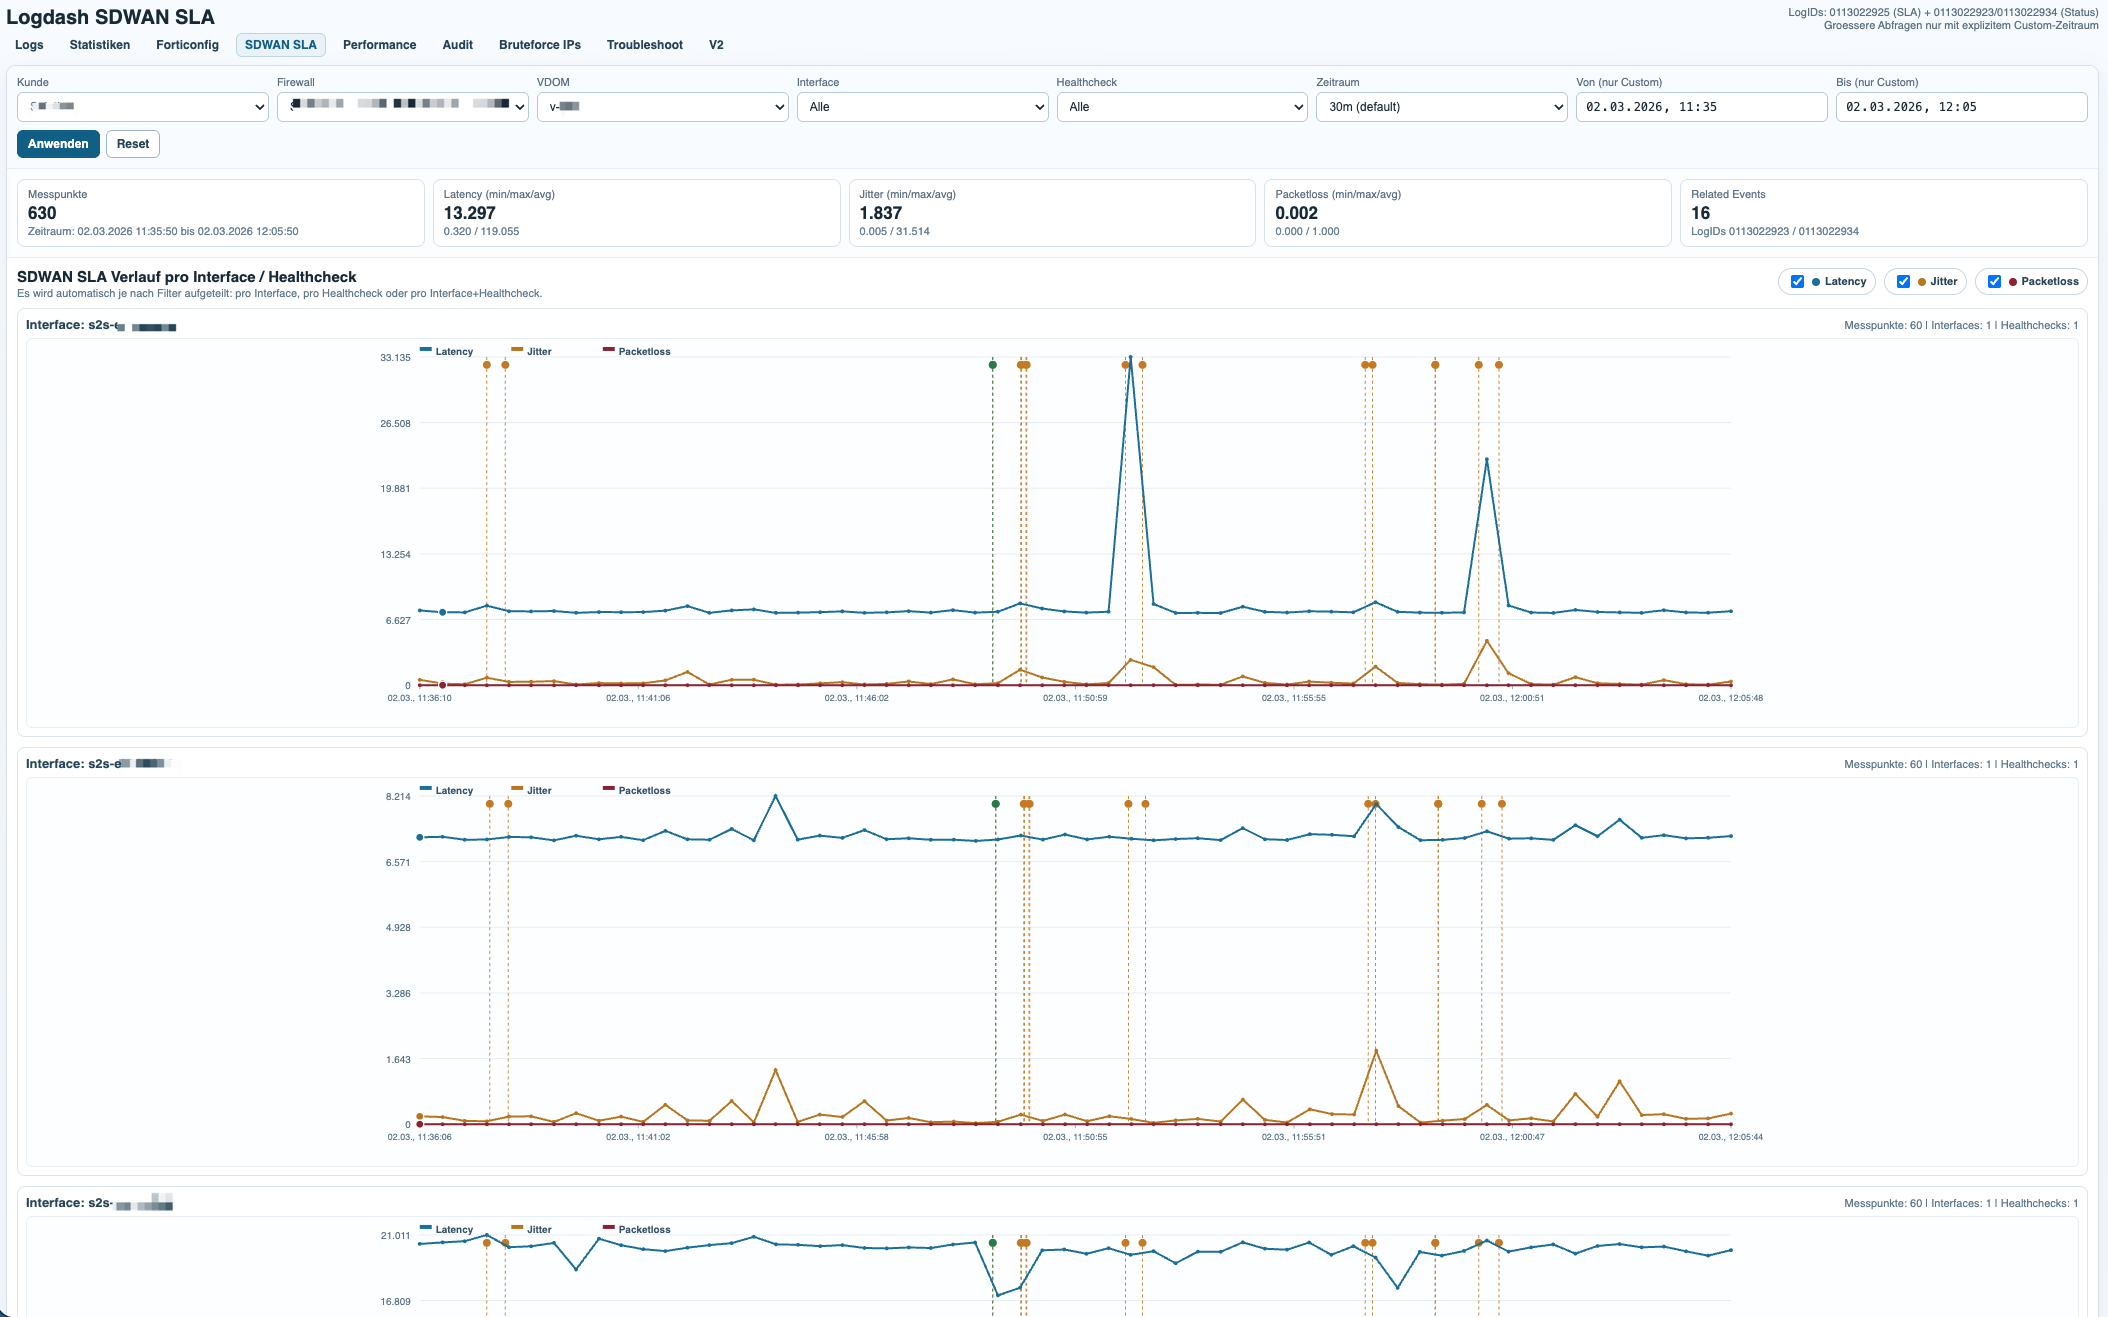
The SD-WAN module extracts SLA and health-check metrics from FortiGate event logs and converts them into time-series graphs and related event views. This makes it possible to track link quality per customer, firewall, VDOM, interface, and health-check target.
Example event:
Health Check SLA status.type=event|subtype=sdwan|status=up|vd=root|logid=0113022925|logdesc=SDWAN SLA information|eventtype=SLA|healthcheck=sla_ping_hq_lan|slatargetid=1|interface=s2s-til1/tpno1|latency=27.340|jitter=0.105|packetloss=0.000|moscodec=g711This entry describes a successful SLA measurement. Logdash extracts the interface, health-check name, latency, jitter, and packet loss, then stores the sample in a time-aligned dataset for graphing and summarization.
Example notification:
Health Check SLA status. SLA failed due to being over the performance metric threshold[packetloss].type=event|subtype=sdwan|status=up|vd=root|logid=0113022933|logdesc=SDWAN SLA notification|eventtype=SLA|healthcheck=dns_cloudflare|slatargetid=1|interface=a|latency=39.233|jitter=9.253|packetloss=50.000|moscodec=g711latency=39.233jitter=9.253packetloss=50.000Here the same telemetry becomes an operational event. The important signal is not only that the health-check exists, but that the SLA failed because packet loss crossed the threshold. Logdash correlates these notification events with the metric stream, which makes it easy to explain why a path degraded and when it recovered.
Performance Analysis
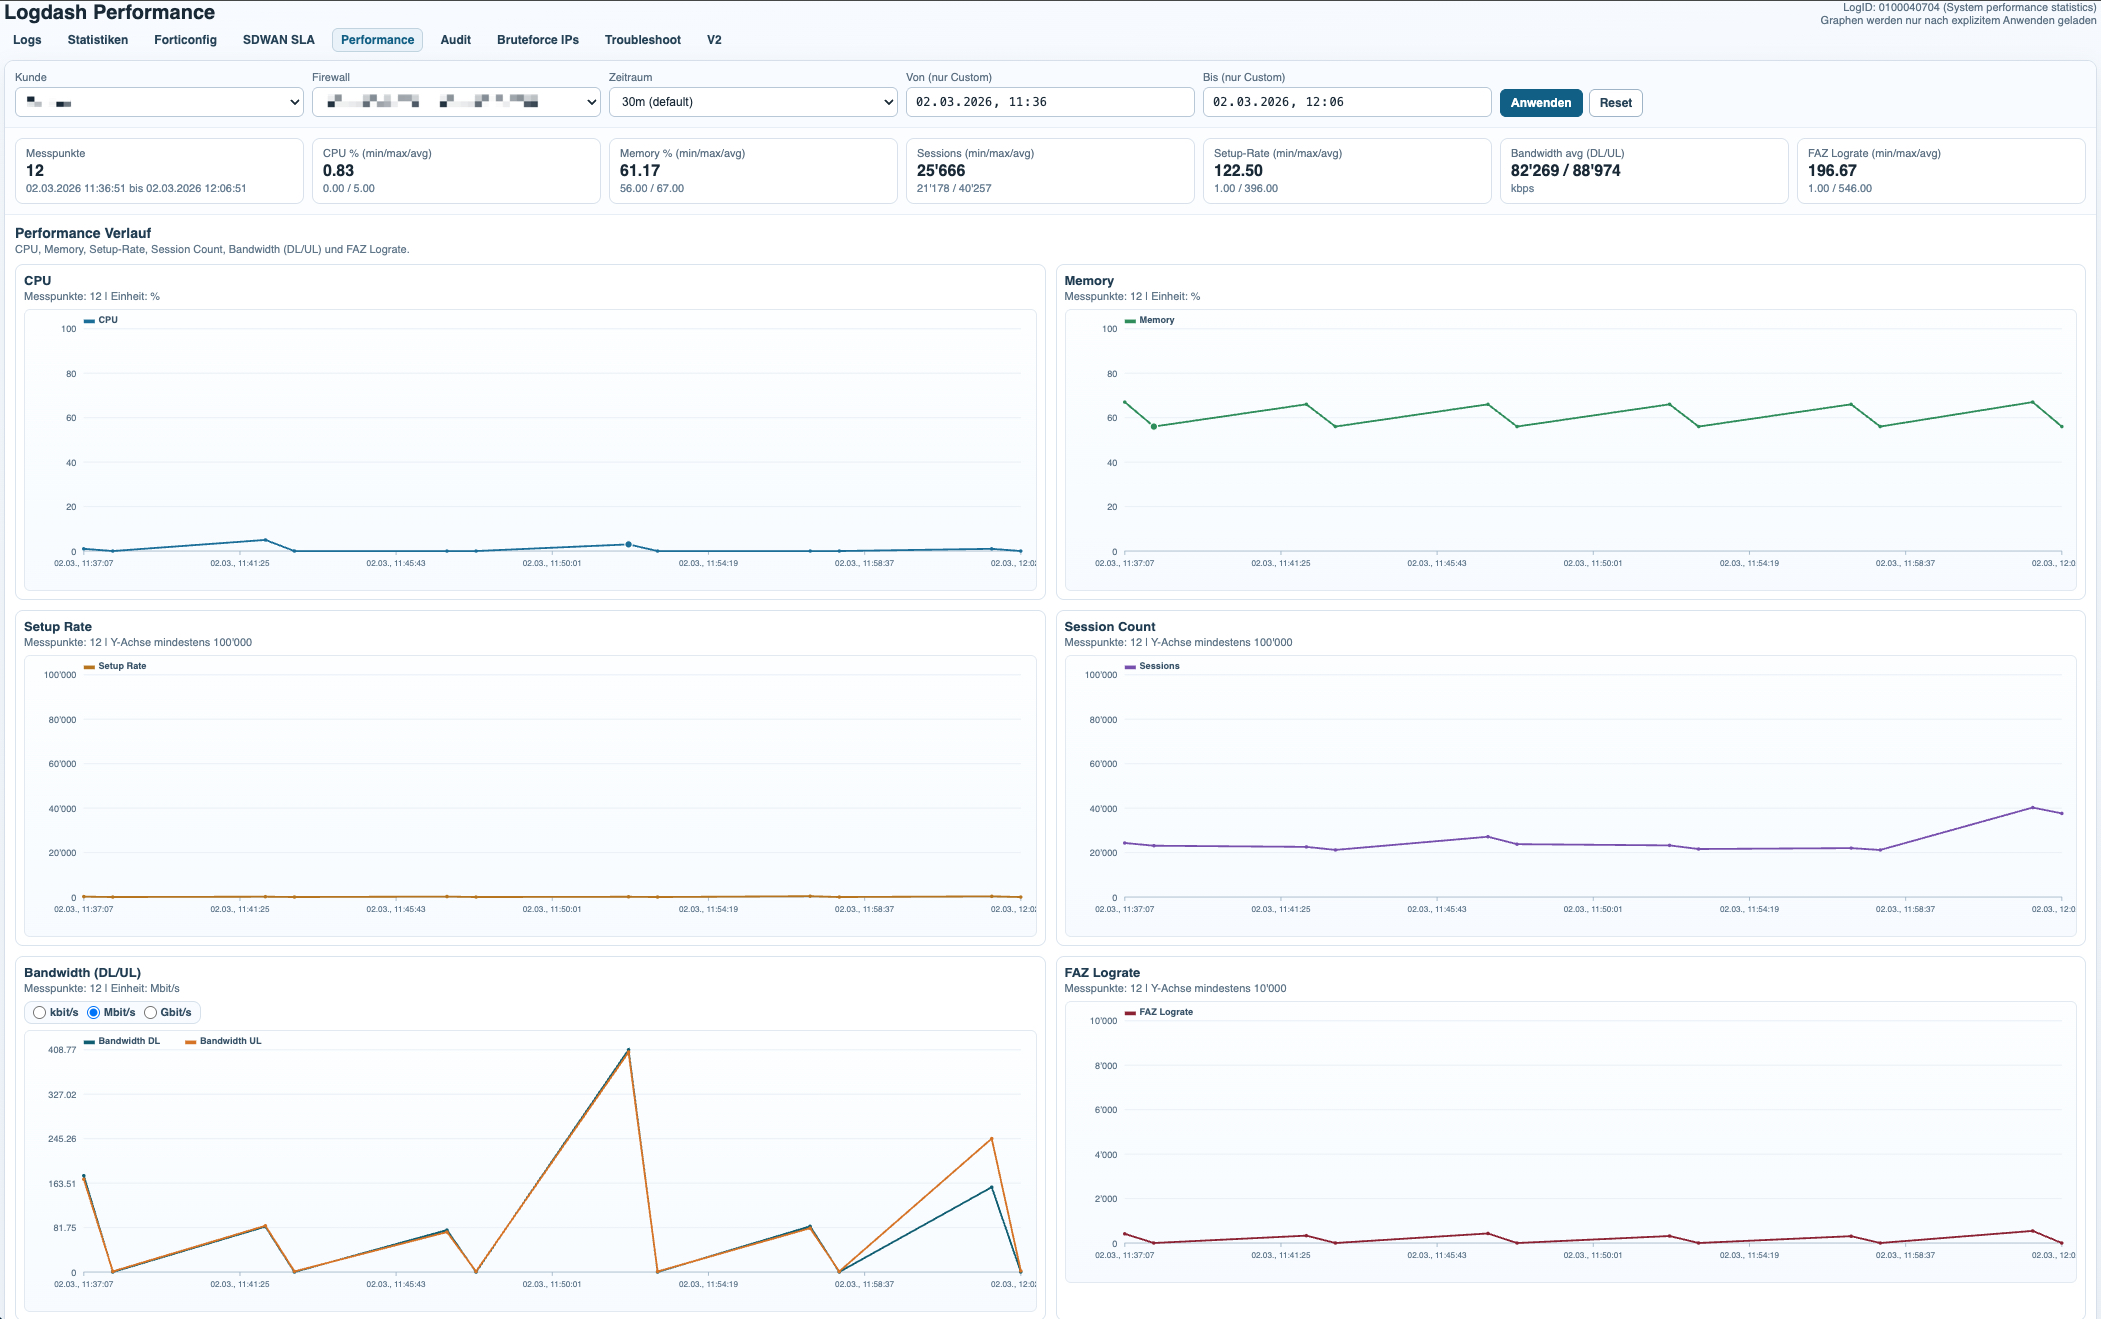
The performance module turns periodic system performance events into a compact monitoring view for firewall health over time. It is designed for trend analysis rather than deep packet analytics, which keeps the dataset small and the interface fast.
Example event:
Performance statistics: average CPU: 0, memory: 64, concurrent sessions: 292, setup-rate: 3action=perf-stats|type=event|subtype=system|vd=root|logid=0100040704|logdesc=System performance statistics|cpu=0|mem=64|totalsession=292|disk=0|bandwidth=7653/7629|setuprate=3|disklograte=0|fazlograte=0From this single log line, Logdash extracts CPU usage, memory usage, concurrent sessions, setup rate, bandwidth, and FAZ log rate. Those values are plotted over time and can be filtered by customer, firewall, and VDOM to identify sustained load, sudden spikes, or unusual operational patterns.
This is especially useful for validating whether an incident was accompanied by resource pressure or whether the firewall remained stable while another subsystem degraded.
Bruteforce Detection and IP Feed Distribution
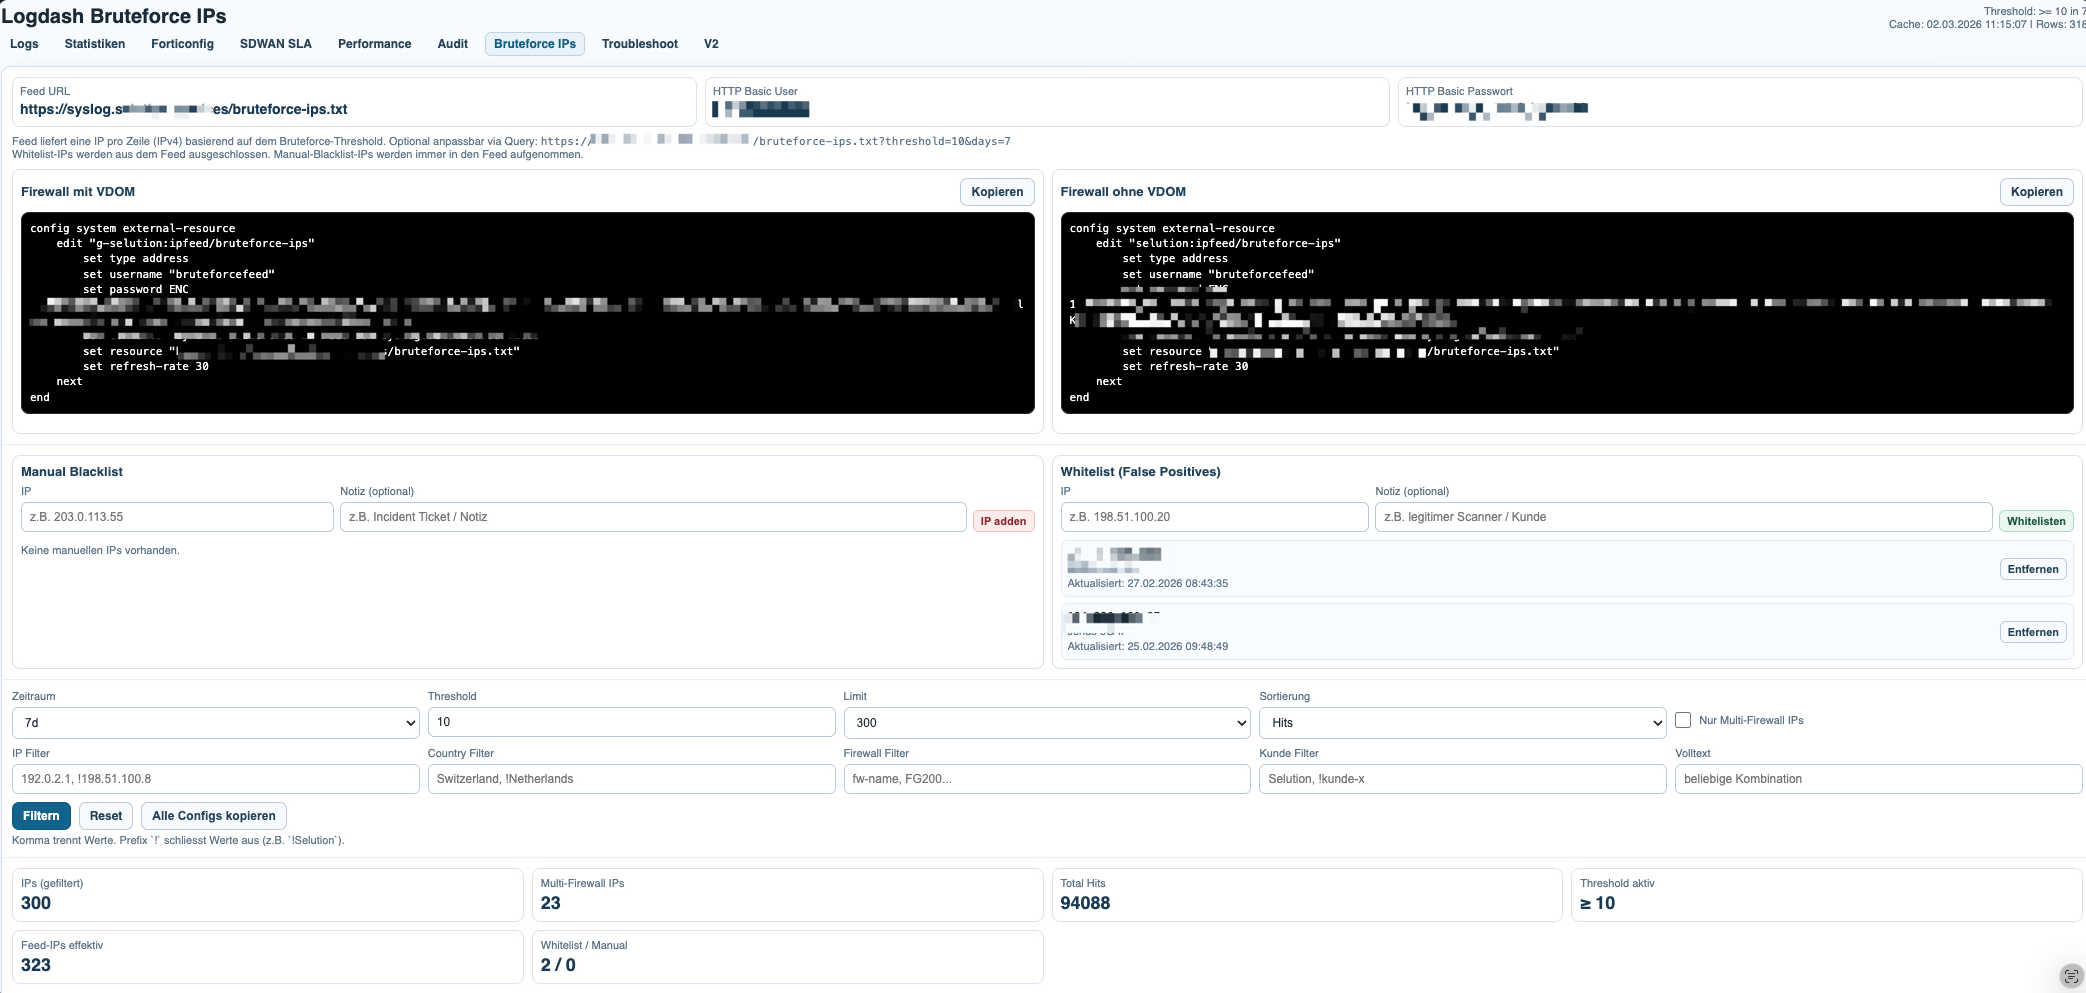
The bruteforce module aggregates repeated authentication-related events into a focused attacker list. Instead of looking at isolated failures, it highlights source IPs, hit counts, countries, affected customers, and the firewalls on which the same source appears.
Example SSL-VPN alert:
SSL alertsaction=ssl-alert|type=event|subtype=vpn|vd=v-xxx|remip=192.253.248.156|logid=0101039944|logdesc=SSL VPN alert|tunneltype=ssl|tunnelid=0|srccountry=Netherlands|reason=warning|desc=close notify|msg=SSL alertsThis event contributes a remote IP, a country, and a VPN-related alert context. On its own, it may only indicate suspicious or noisy behavior. Once the same source IP appears repeatedly, it becomes a strong candidate for the bruteforce list.
Example IPsec negotiation failure:
action=negotiate|type=event|subtype=vpn|status=negotiate_error|vd=v-xxxx|remip=85.22.156.53|locip=195.48.x.x|outintf=vl0993|logid=0101037124|logdesc=IPsec phase 1 error|msg=IPsec phase 1 error|remport=500|locport=500|cookies=d7670756c0ea3964/0000000000000000This event is analyzed differently. It shows a failed VPN negotiation and can be relevant for troubleshooting or attack correlation, but it is not automatically equivalent to an SSL-VPN bruteforce indicator. The value of Logdash is that it can distinguish between event types while still exposing repeated remote IP patterns across the full dataset.
The probability of malicious activity rises significantly when the same source IP hits multiple customers or multiple firewalls in the same time window. That cross-customer correlation is one of the strongest signals in the module, because it separates isolated noise from distributed scanning or targeted bruteforce behavior.
Once the list has been built, it can be published through a central IP feed. Firewalls can then consume that feed as an external blocklist source, which turns log analysis into a lightweight response mechanism without requiring a heavy management stack.
Server Statistics and Capacity Visibility
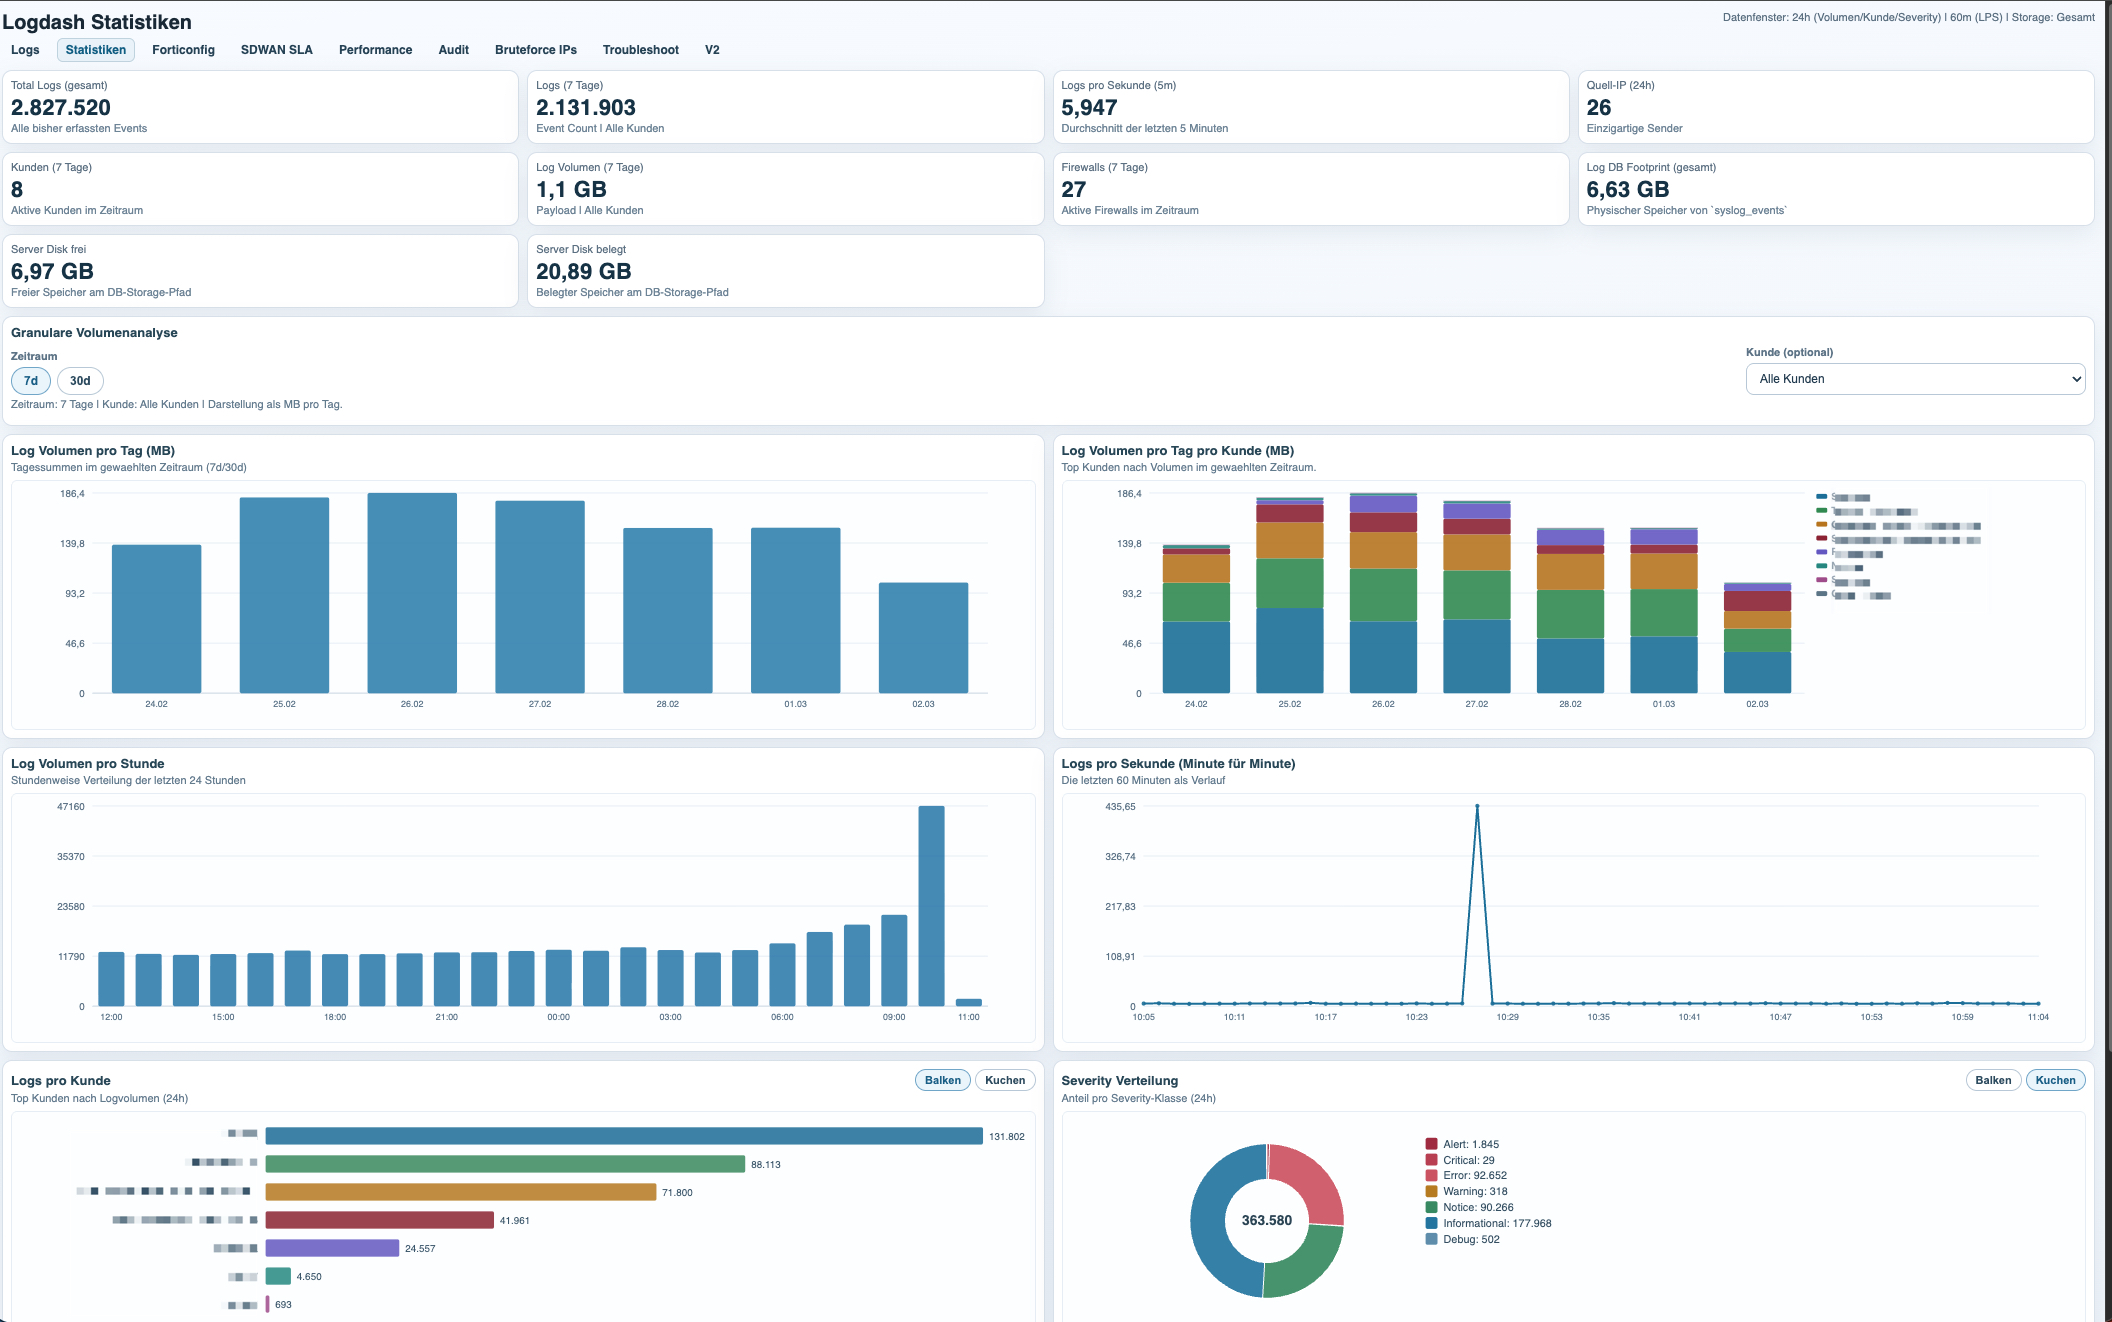
The statistics dashboard focuses on the server side of the platform itself. Its purpose is to track how much event data is being generated, which customers or firewalls are responsible for the volume, and how much storage and system capacity the logging stack is consuming.
This view is useful for both technical planning and operational hygiene. It shows which environments are unusually noisy, how log volume changes over time, how many logs per second the platform is processing, and how much database and disk space the server is using.
That makes the statistics page more than a generic server monitor. It is the capacity view for the syslog platform itself, with enough detail to understand who generates the data and how that load translates into backend resource usage.
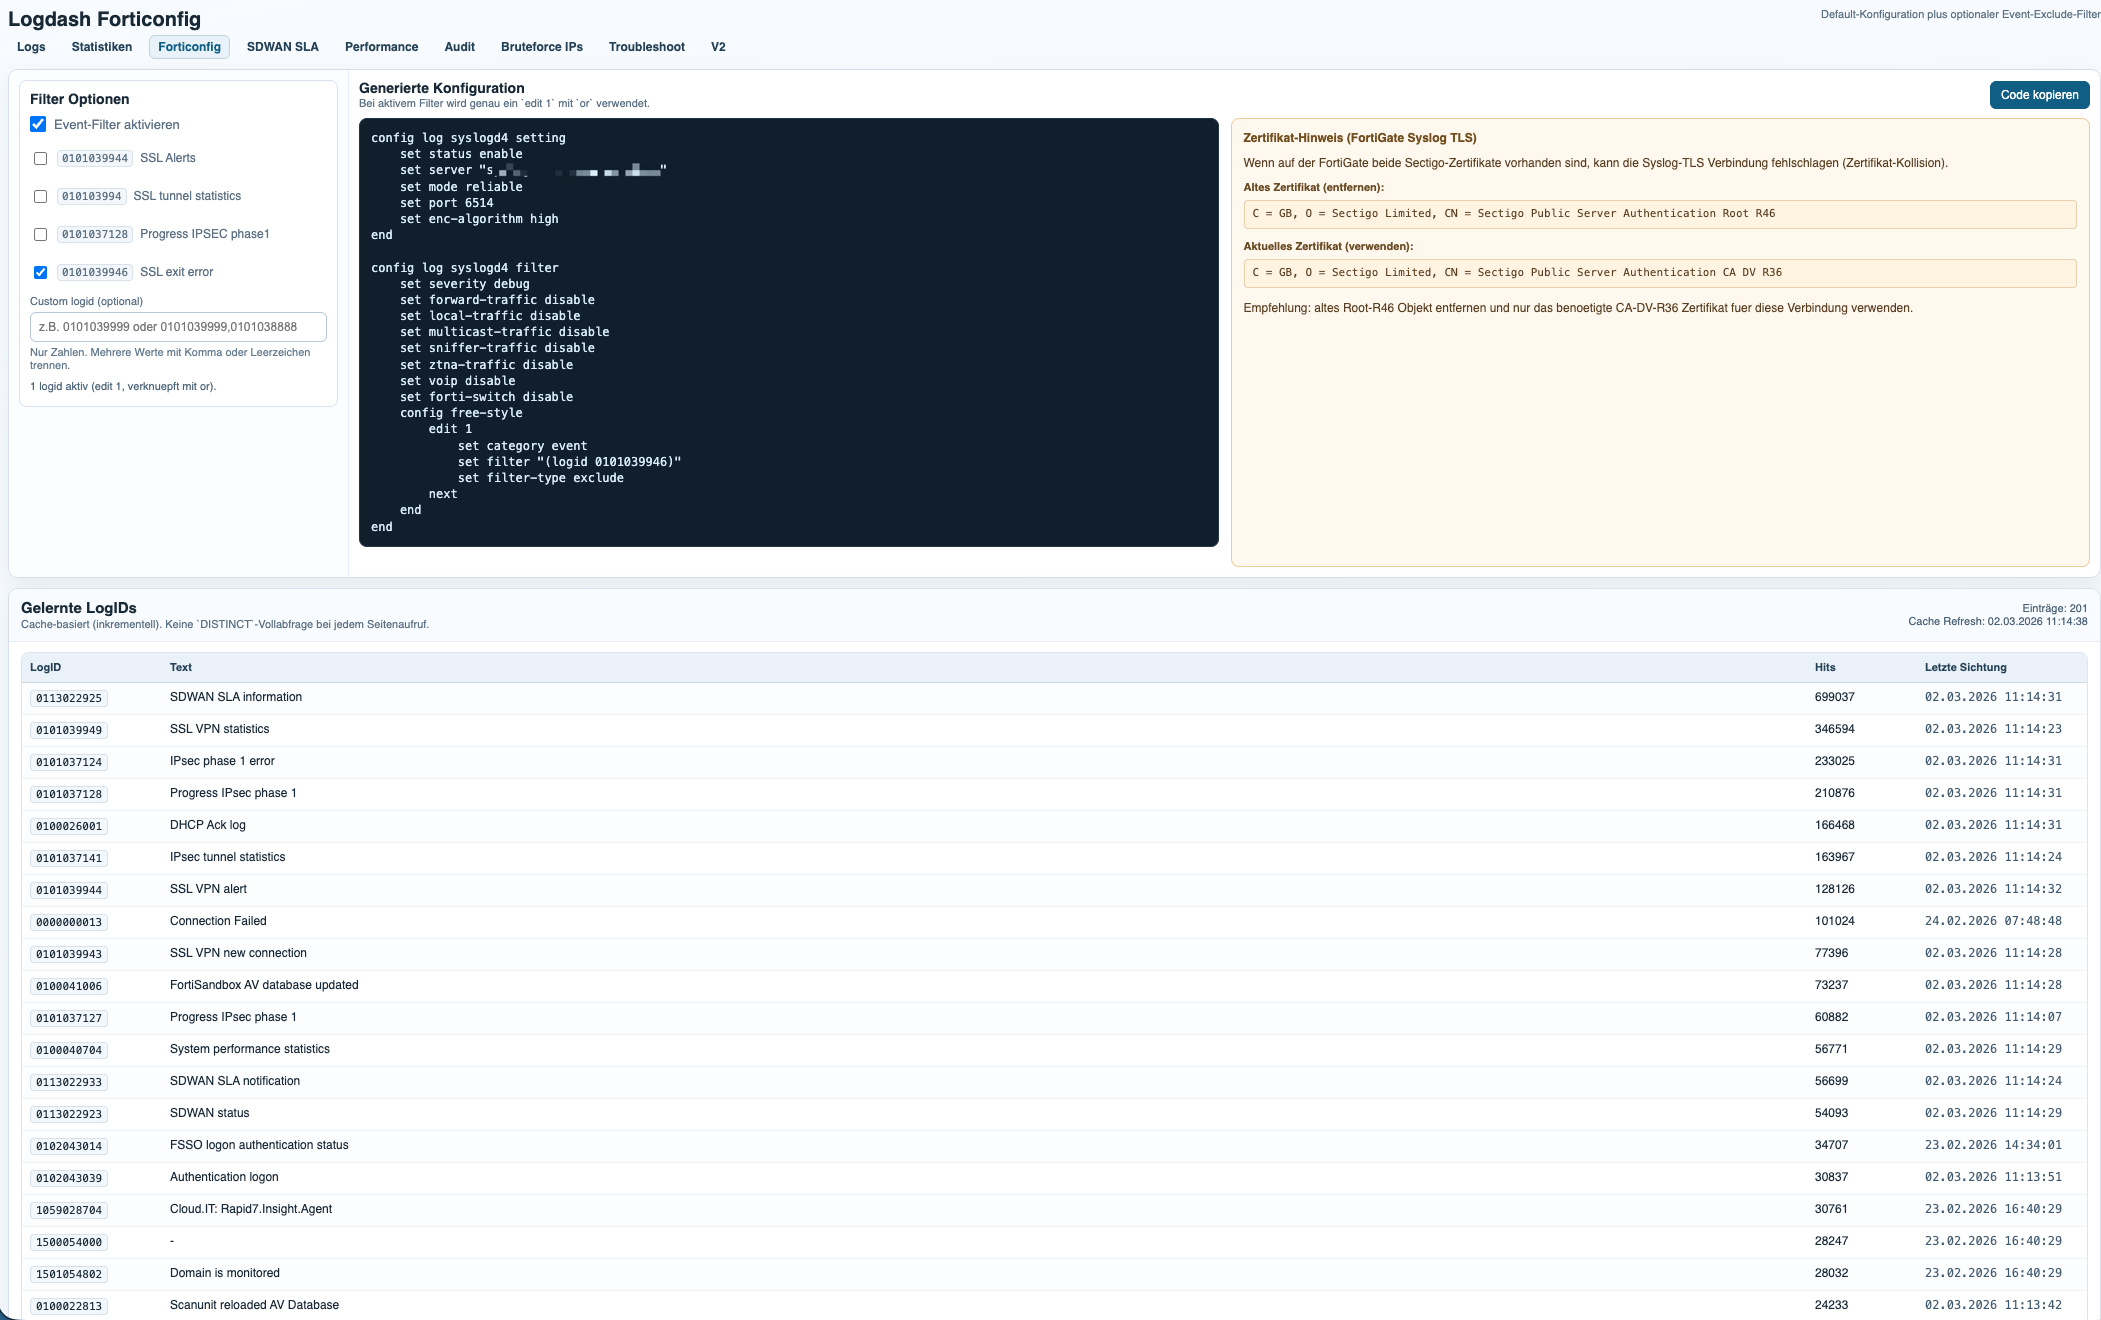
The FortiConfig module generates the base Syslog TLS configuration for FortiGate and adds optional event log filters on top. This makes it easy to standardize onboarding while still keeping noisy or irrelevant event classes out of the dataset.
The filter logic is based on learned LogIDs already seen by the platform. In practice, this allows operators to exclude specific event types from forwarding, reduce unnecessary log volume, and keep the focus on operationally relevant signals such as audit, SD-WAN, performance, VPN, and security events.
This is especially useful in larger environments, where a small number of noisy LogIDs can distort the dataset or waste storage without adding real analytical value.
Arbeitet in Raum Basel (Switzerland) als Senior Network Engineer mit über 15 Jahren Erfahrung im Bereich Netzwerk