 Download als PDF File
Building a DIY ESP Temperature Logger to Find Out
Modern access points are no longer just radios.
They’re basically small servers with antennas.
- Multi-core CPUs.
- Three radios.
- 320 MHz channels.
- Multi-Gig uplinks.
- Up to 60 watts PoE.
Which raises a very simple but very practical question:
How hot do they get?
And more importantly:
What happens when you put one inside a sealed enclosure?
The Problem
We are rolling out new Cisco C9176 Wi-Fi 6E/7 access points.
These devices must be installed inside existing Thuba EX enclosures that were originally designed for older, less power-hungry hardware.
More power means more heat.
And heat inside a closed plastic box is rarely a good thing.
Higher temperatures can reduce:
- lifetime
- stability
- RF performance
- component reliability
Instead of guessing or relying on datasheets, we decided to measure it properly.
The Goal
We wanted real numbers.
Specifically:
- temperature inside the enclosure
- behaviour at 30 W vs 60 W PoE
- idle vs heavy traffic
- long-term stability
No cloud.
No complex lab setup.
Just a small autonomous logger that runs for days.
Building the Temperature Logger
Rather than buying a commercial system, we built one.
Because honestly — this is the perfect excuse to play with microcontrollers.
The idea:
A tiny ESP that:
- measures temperature
- timestamps values
- logs to flash
- hosts a small web interface
All self-contained.
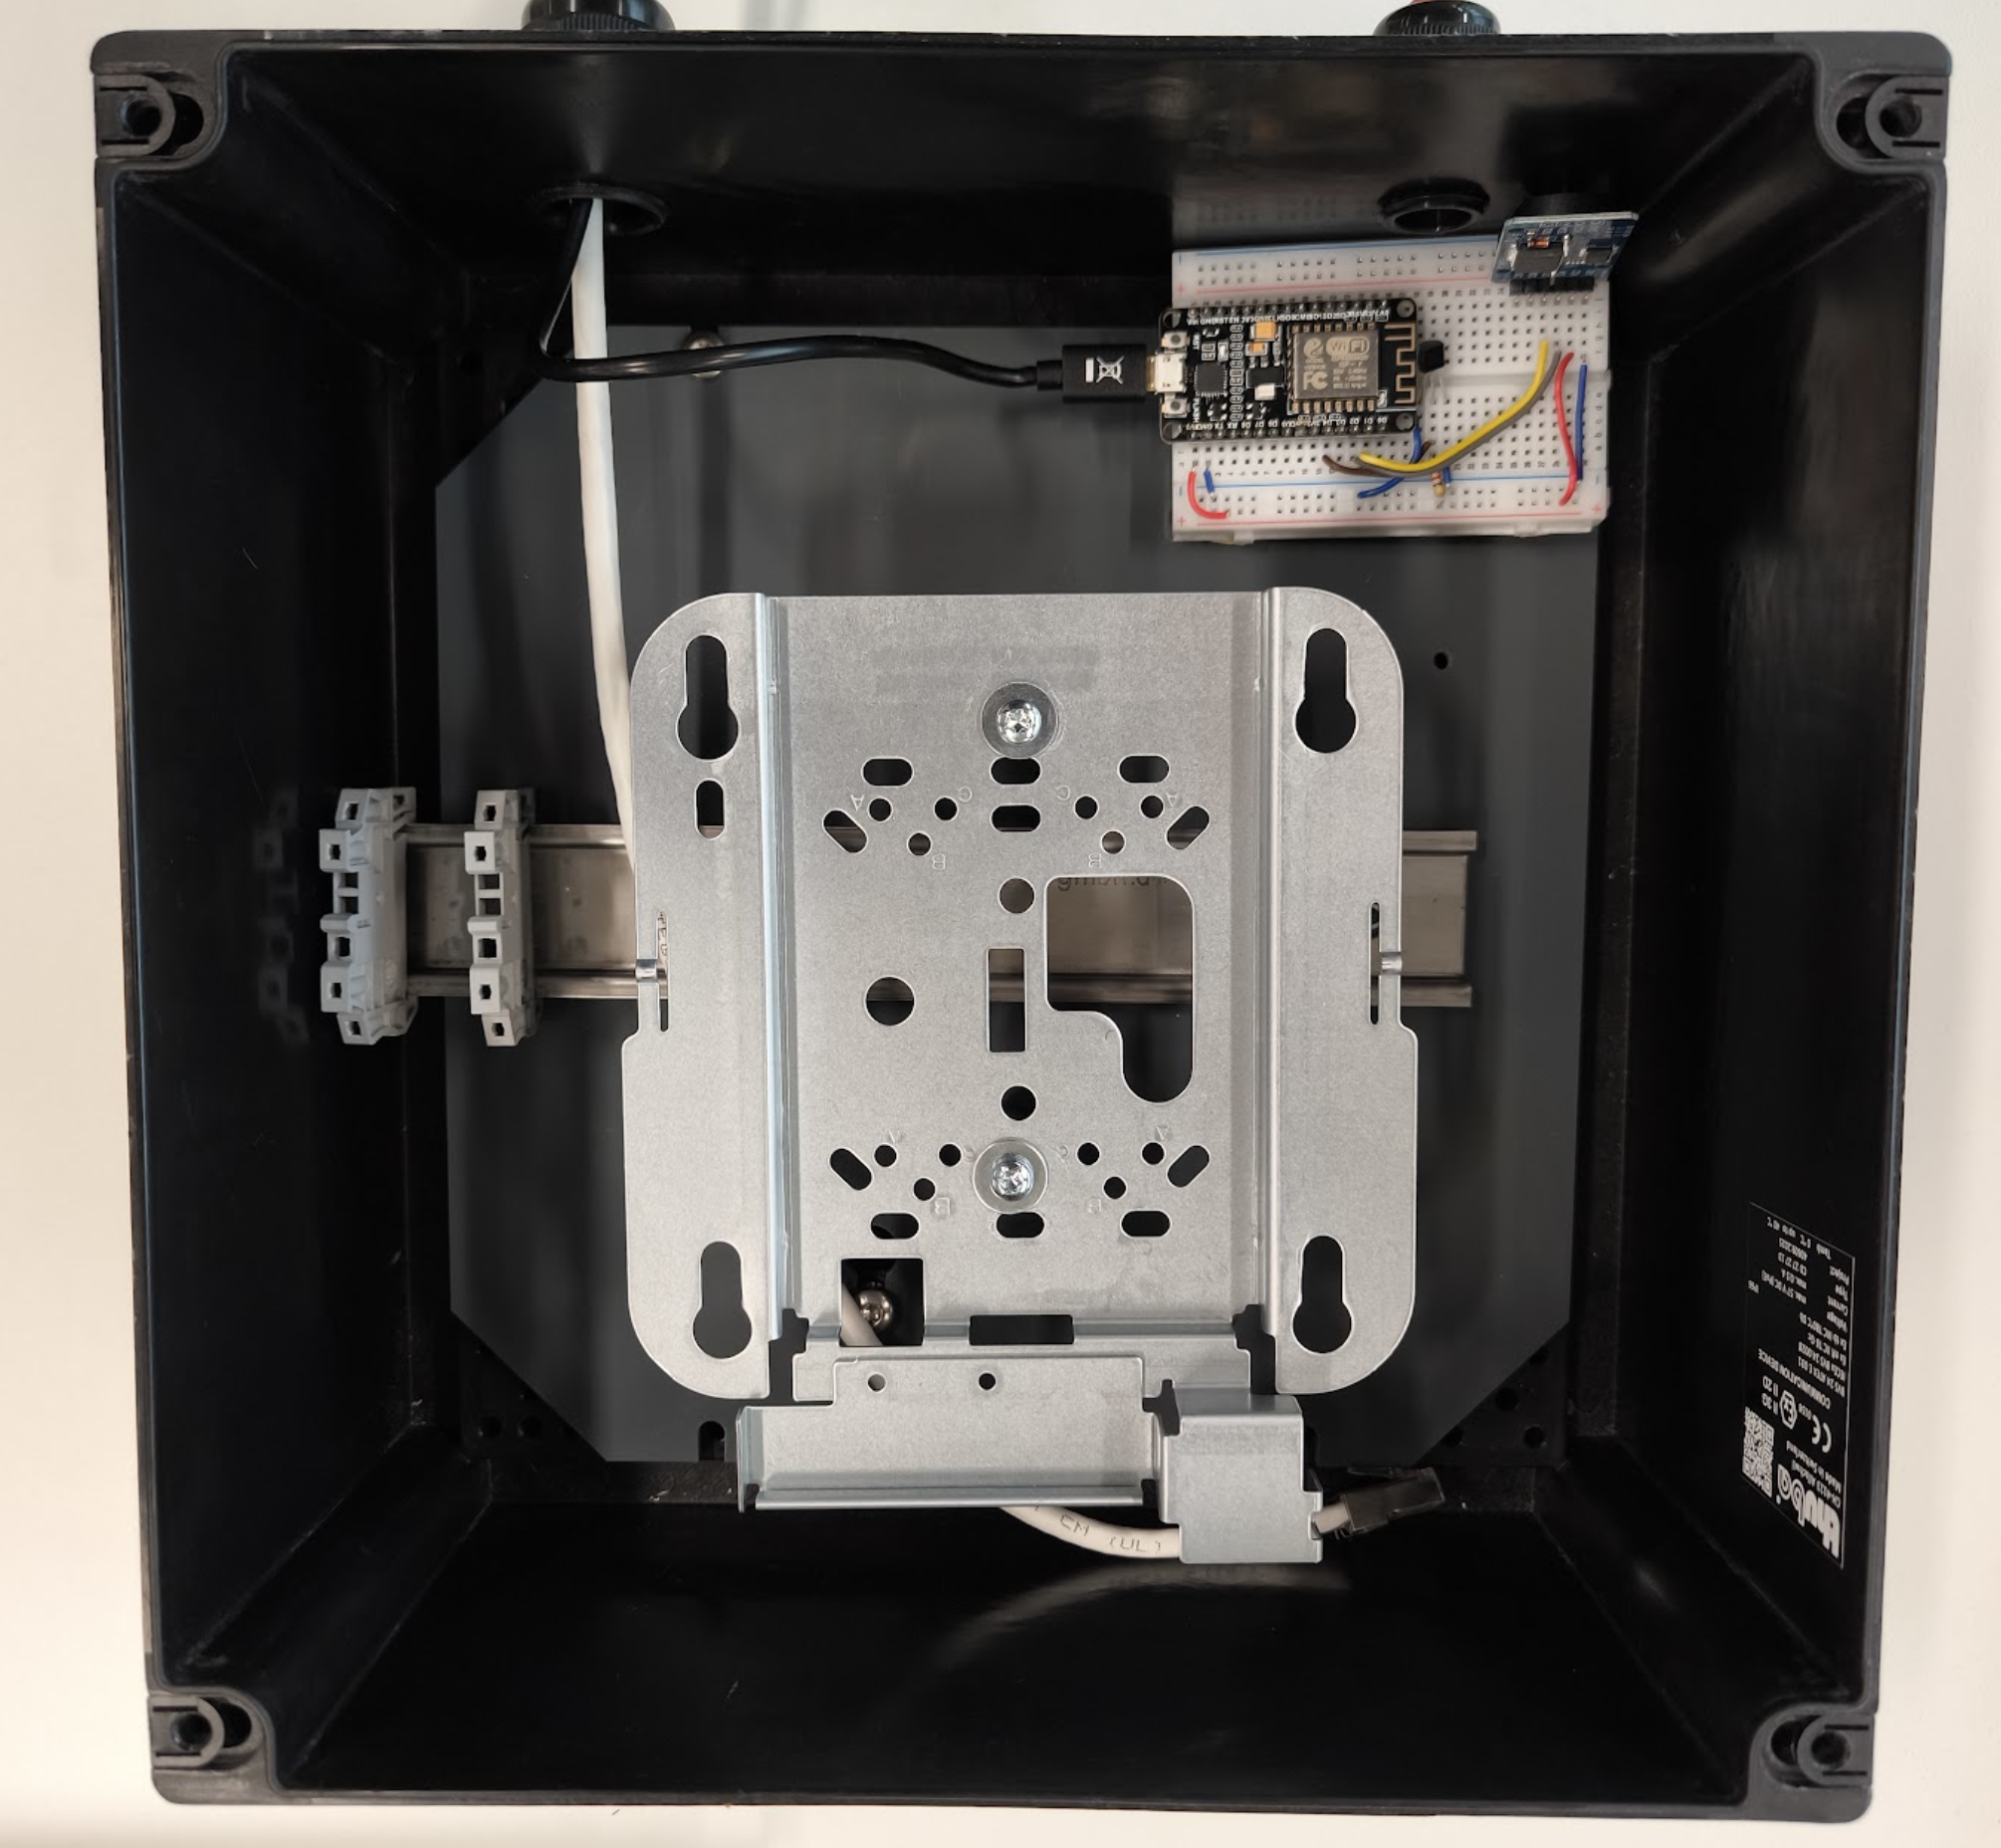
Hardware
Components used:
- ESP8266 (NodeMCU)
- DS18B20 temperature sensor (TO-92 chip)
- DS3231 RTC (real time clock)
- 4.7 kΩ pull-up resistor
- breadboard + USB power
Cheap, simple, reliable.
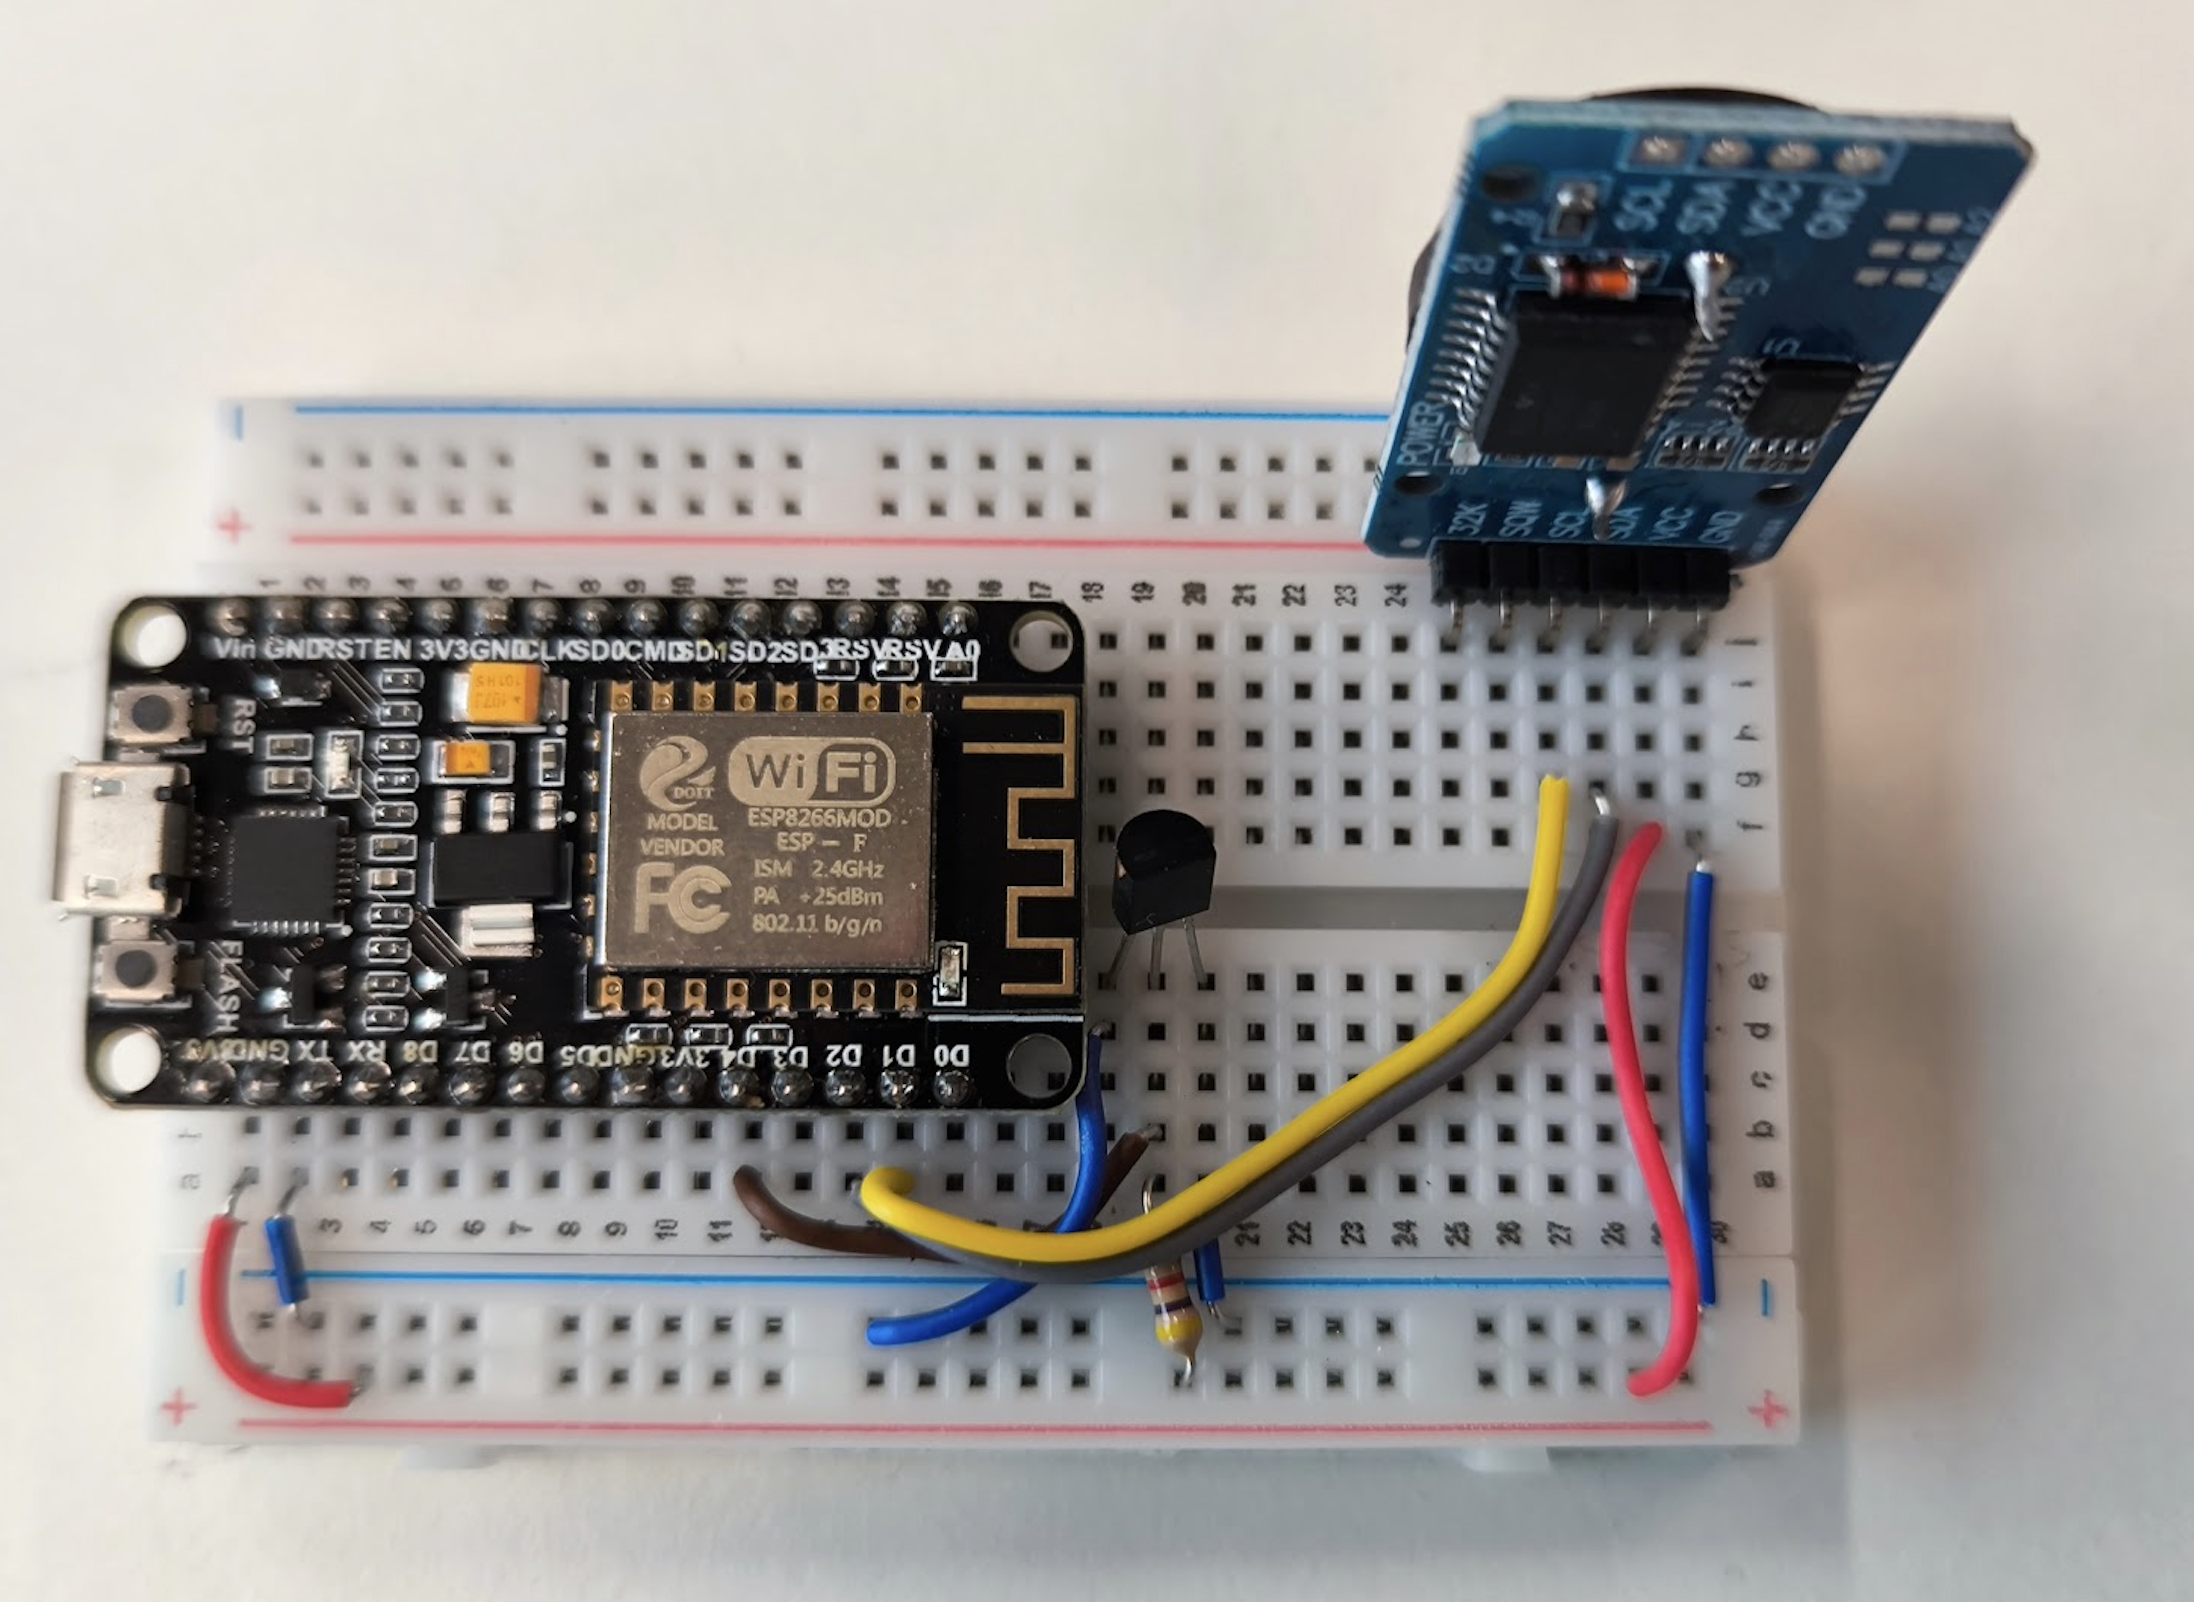
This is the complete logger. No fancy PCB. Just pure lab energy.
Wiring
The sensor uses 1-Wire.
The clock uses I²C.
Three wires and a resistor. Done.
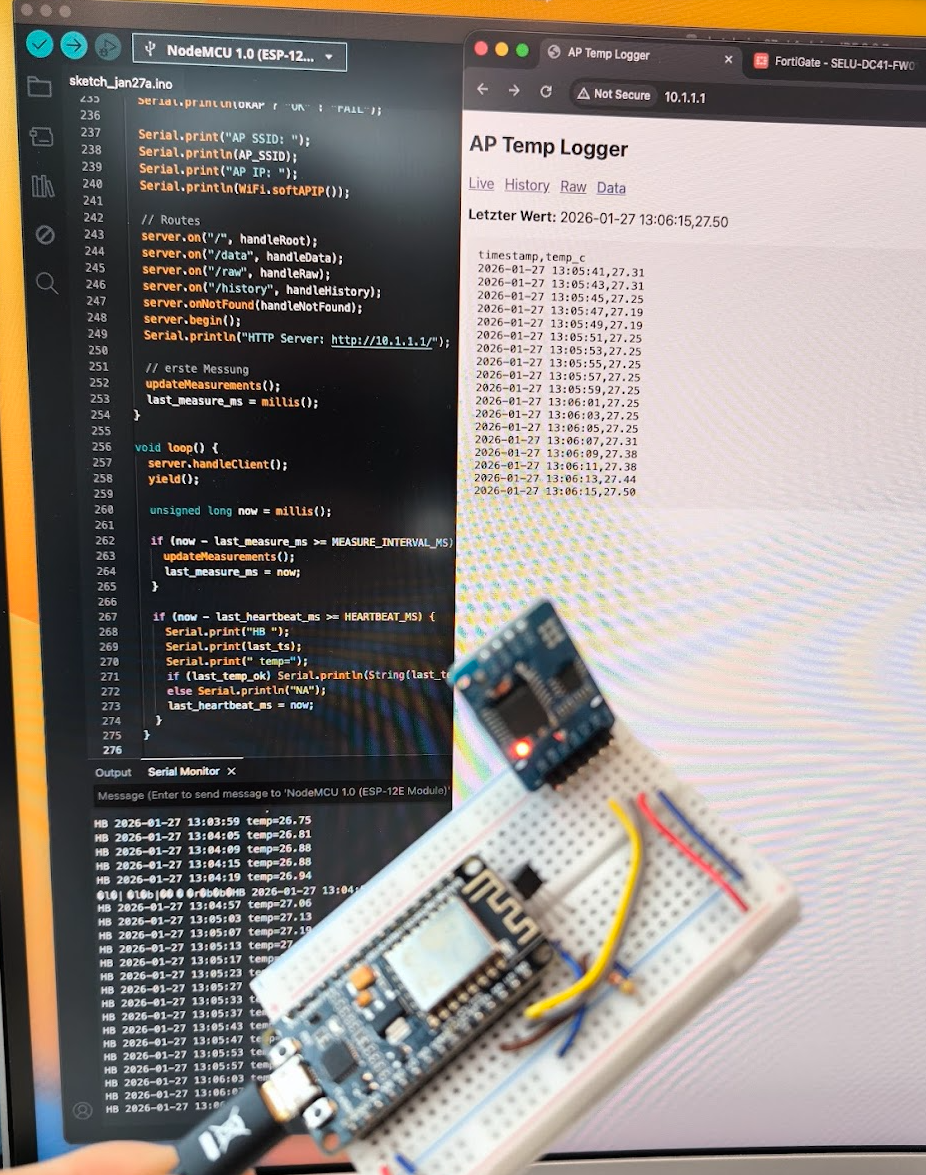
Software
The firmware is intentionally minimal.
Every 5 seconds it:
-
reads temperature
-
gets timestamp from RTC
-
appends CSV line to flash
Example:
Simple formats are beautiful.
Excel loves them. Python loves them. Everything loves them.
You can Download the Code from my Github page:
https://github.com/samuelheinrich/ESP8266_Temperatursensor
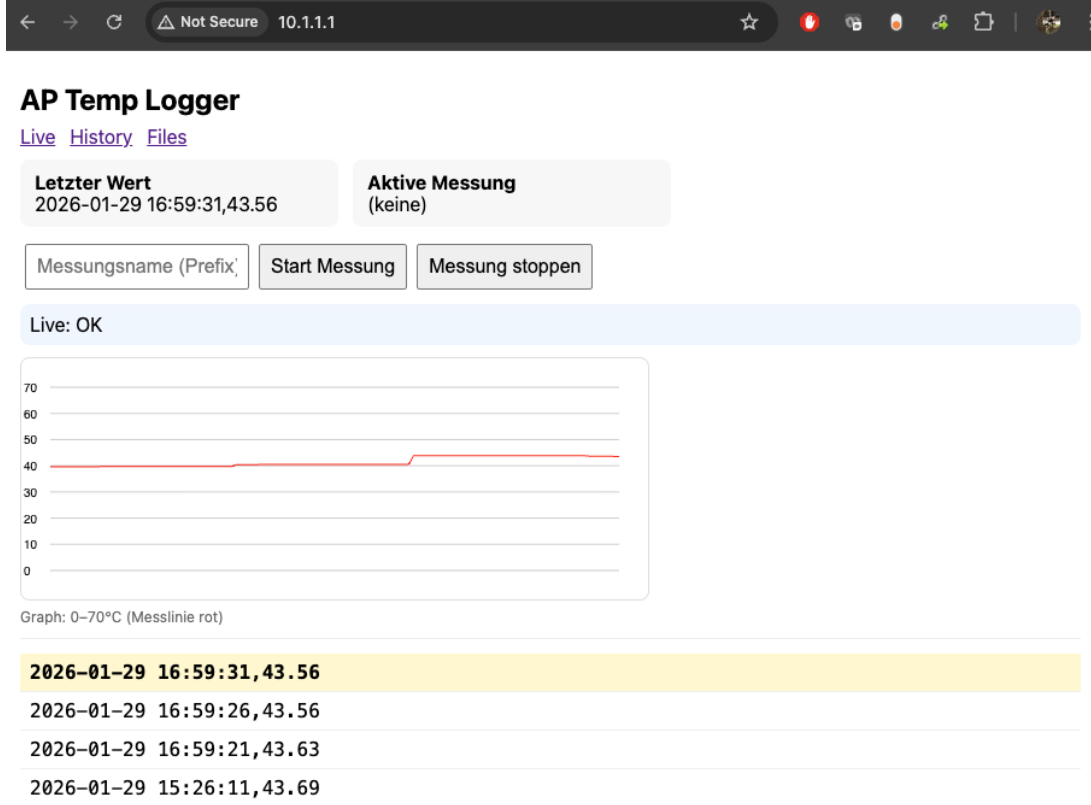
Built-in Web Interface
The ESP also creates its own Wi-Fi access point:
No router needed.
Open browser → done.
Features:
- live values
- history
- real-time graphs
- start/stop measurement
- CSV download
- file delete
It’s basically a tiny self-hosted logging appliance.
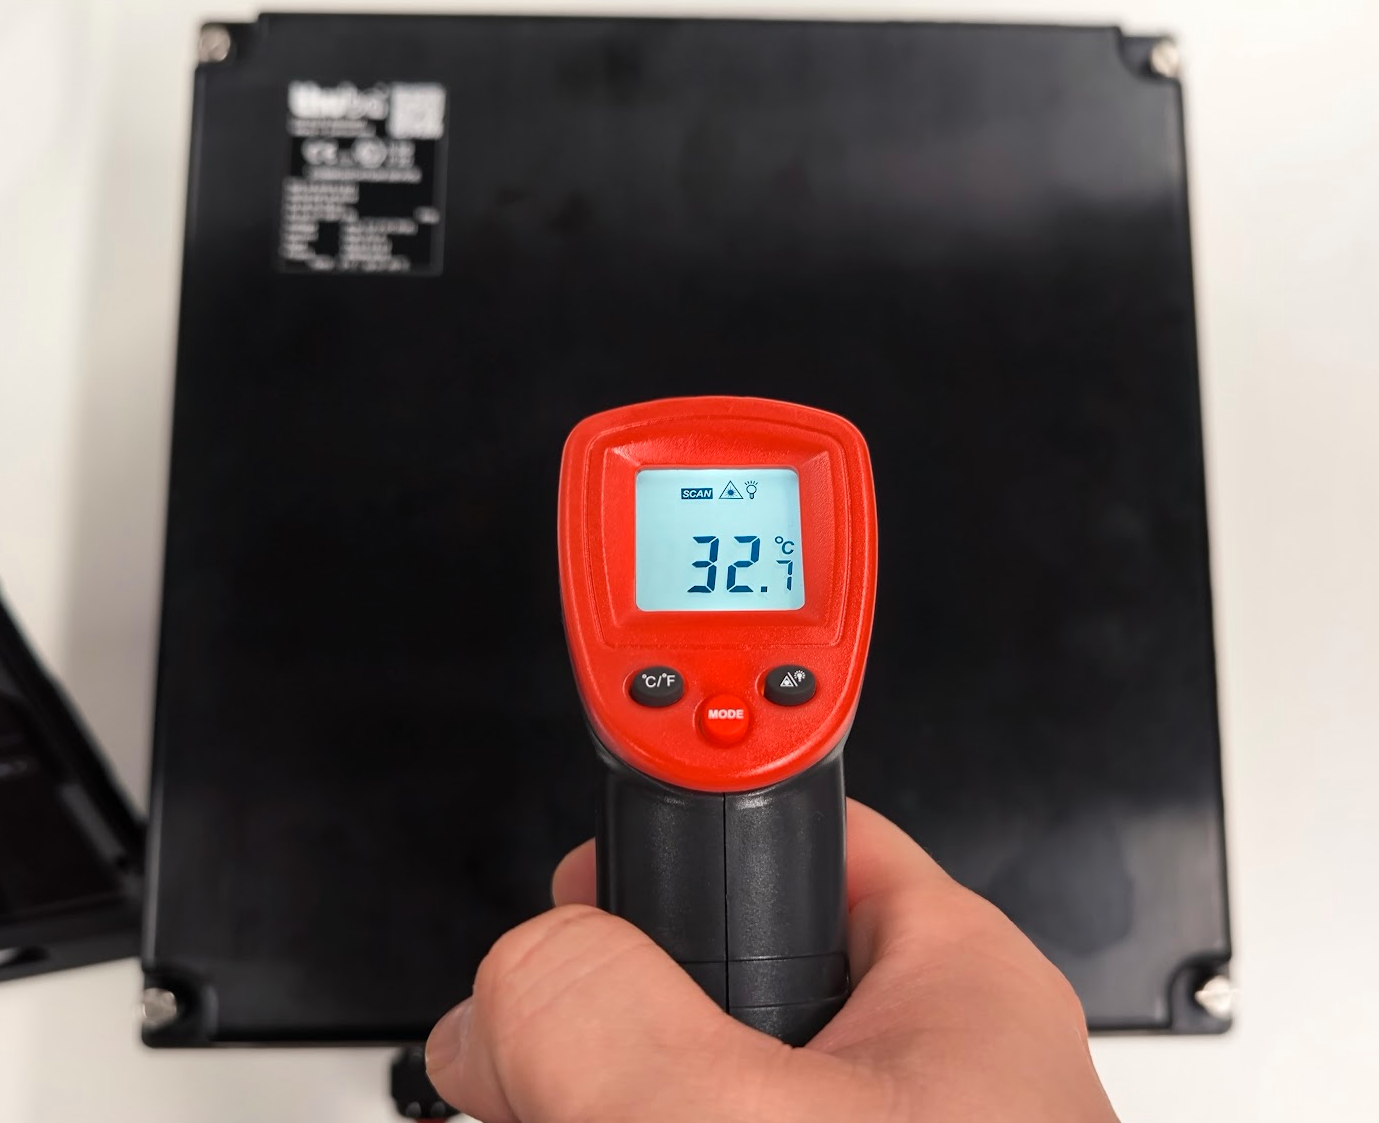
Installing It Inside the Enclosure
The DS18B20 chip is placed freely in the air space of the housing.
Not glued to metal.
Not touching the AP.
We wanted ambient internal air temperature, not hotspot readings.
The logger board is mounted inside the enclosure and powered via USB.
Generating Load
Idle temperatures are boring.
We needed worst case.
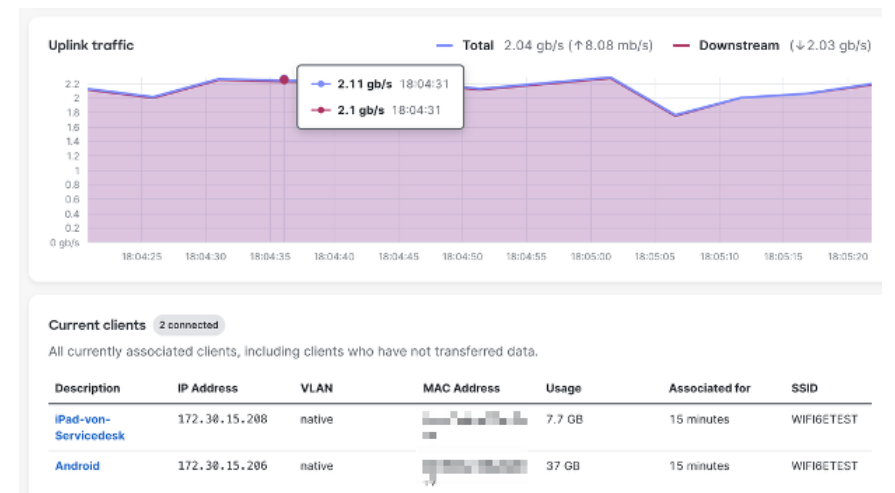
Traffic generation was done with iperf3 (TCP).
Two Wi-Fi 6E clients streamed traffic to a wired server:
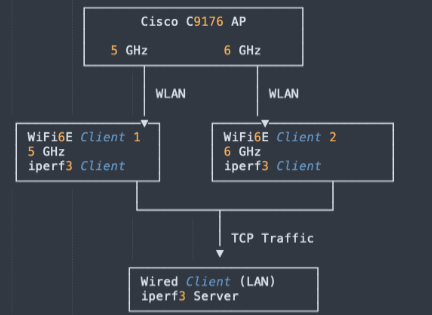
Single-band only per test to isolate each radio.
WIFI Client 1 -> 5GHz 80Mhz 2SS
WIFI Client 2 -> 6GHz 160MHz 2SS
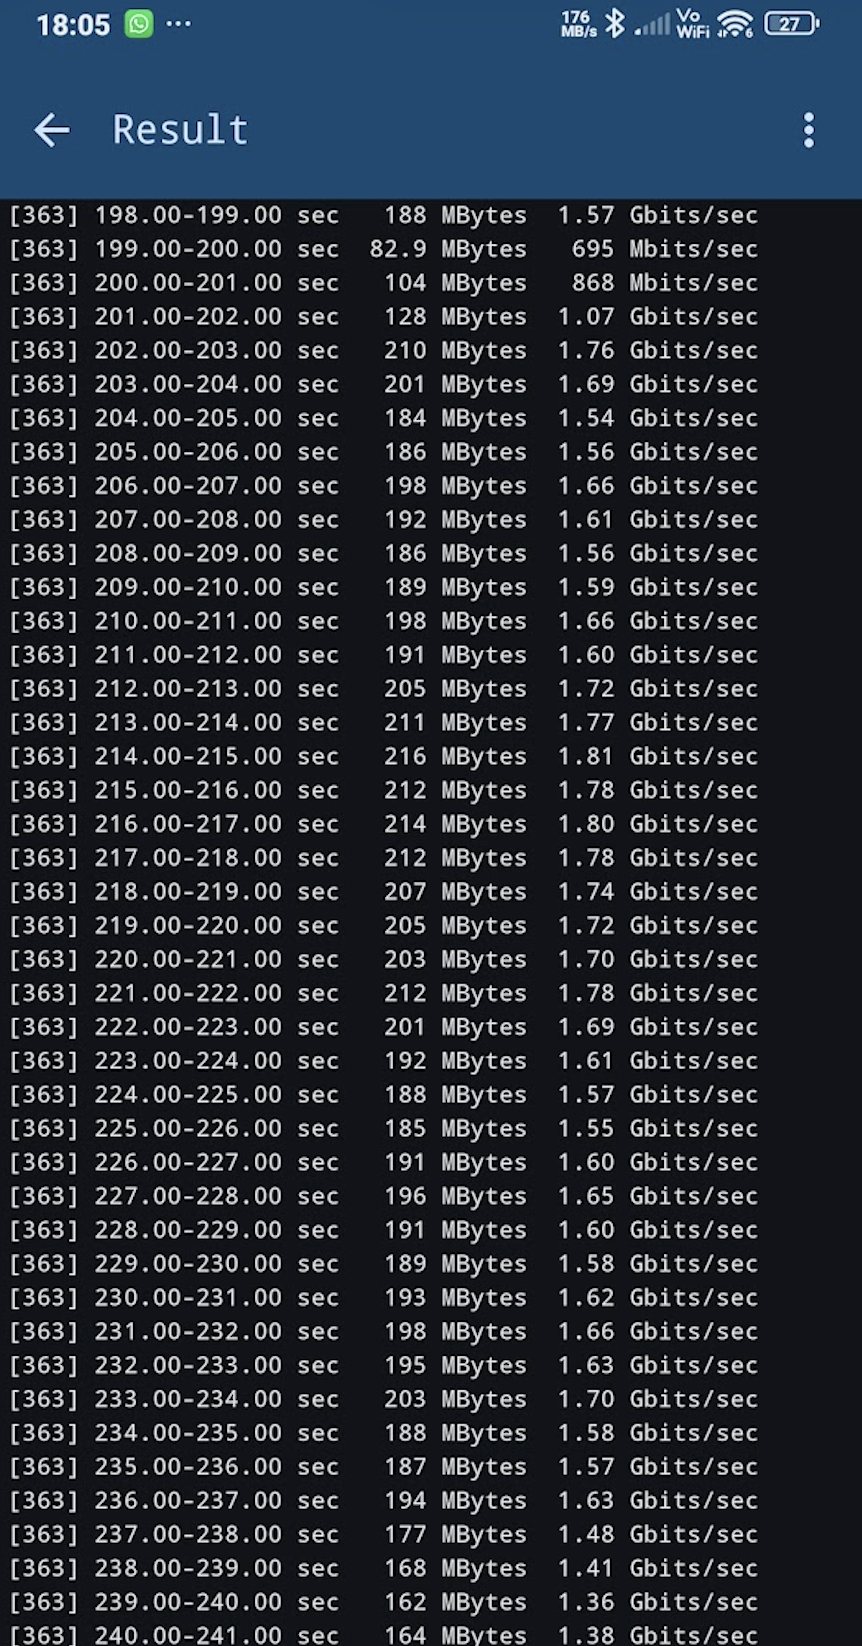
Let’s go!!!
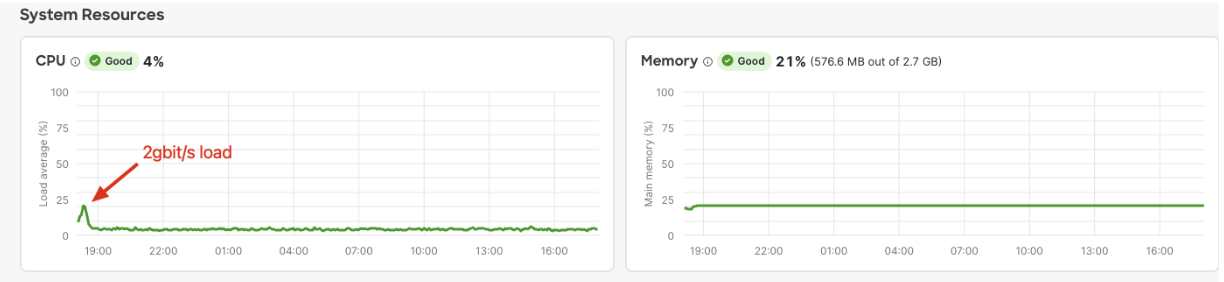
CPU Impact during Traffic Load
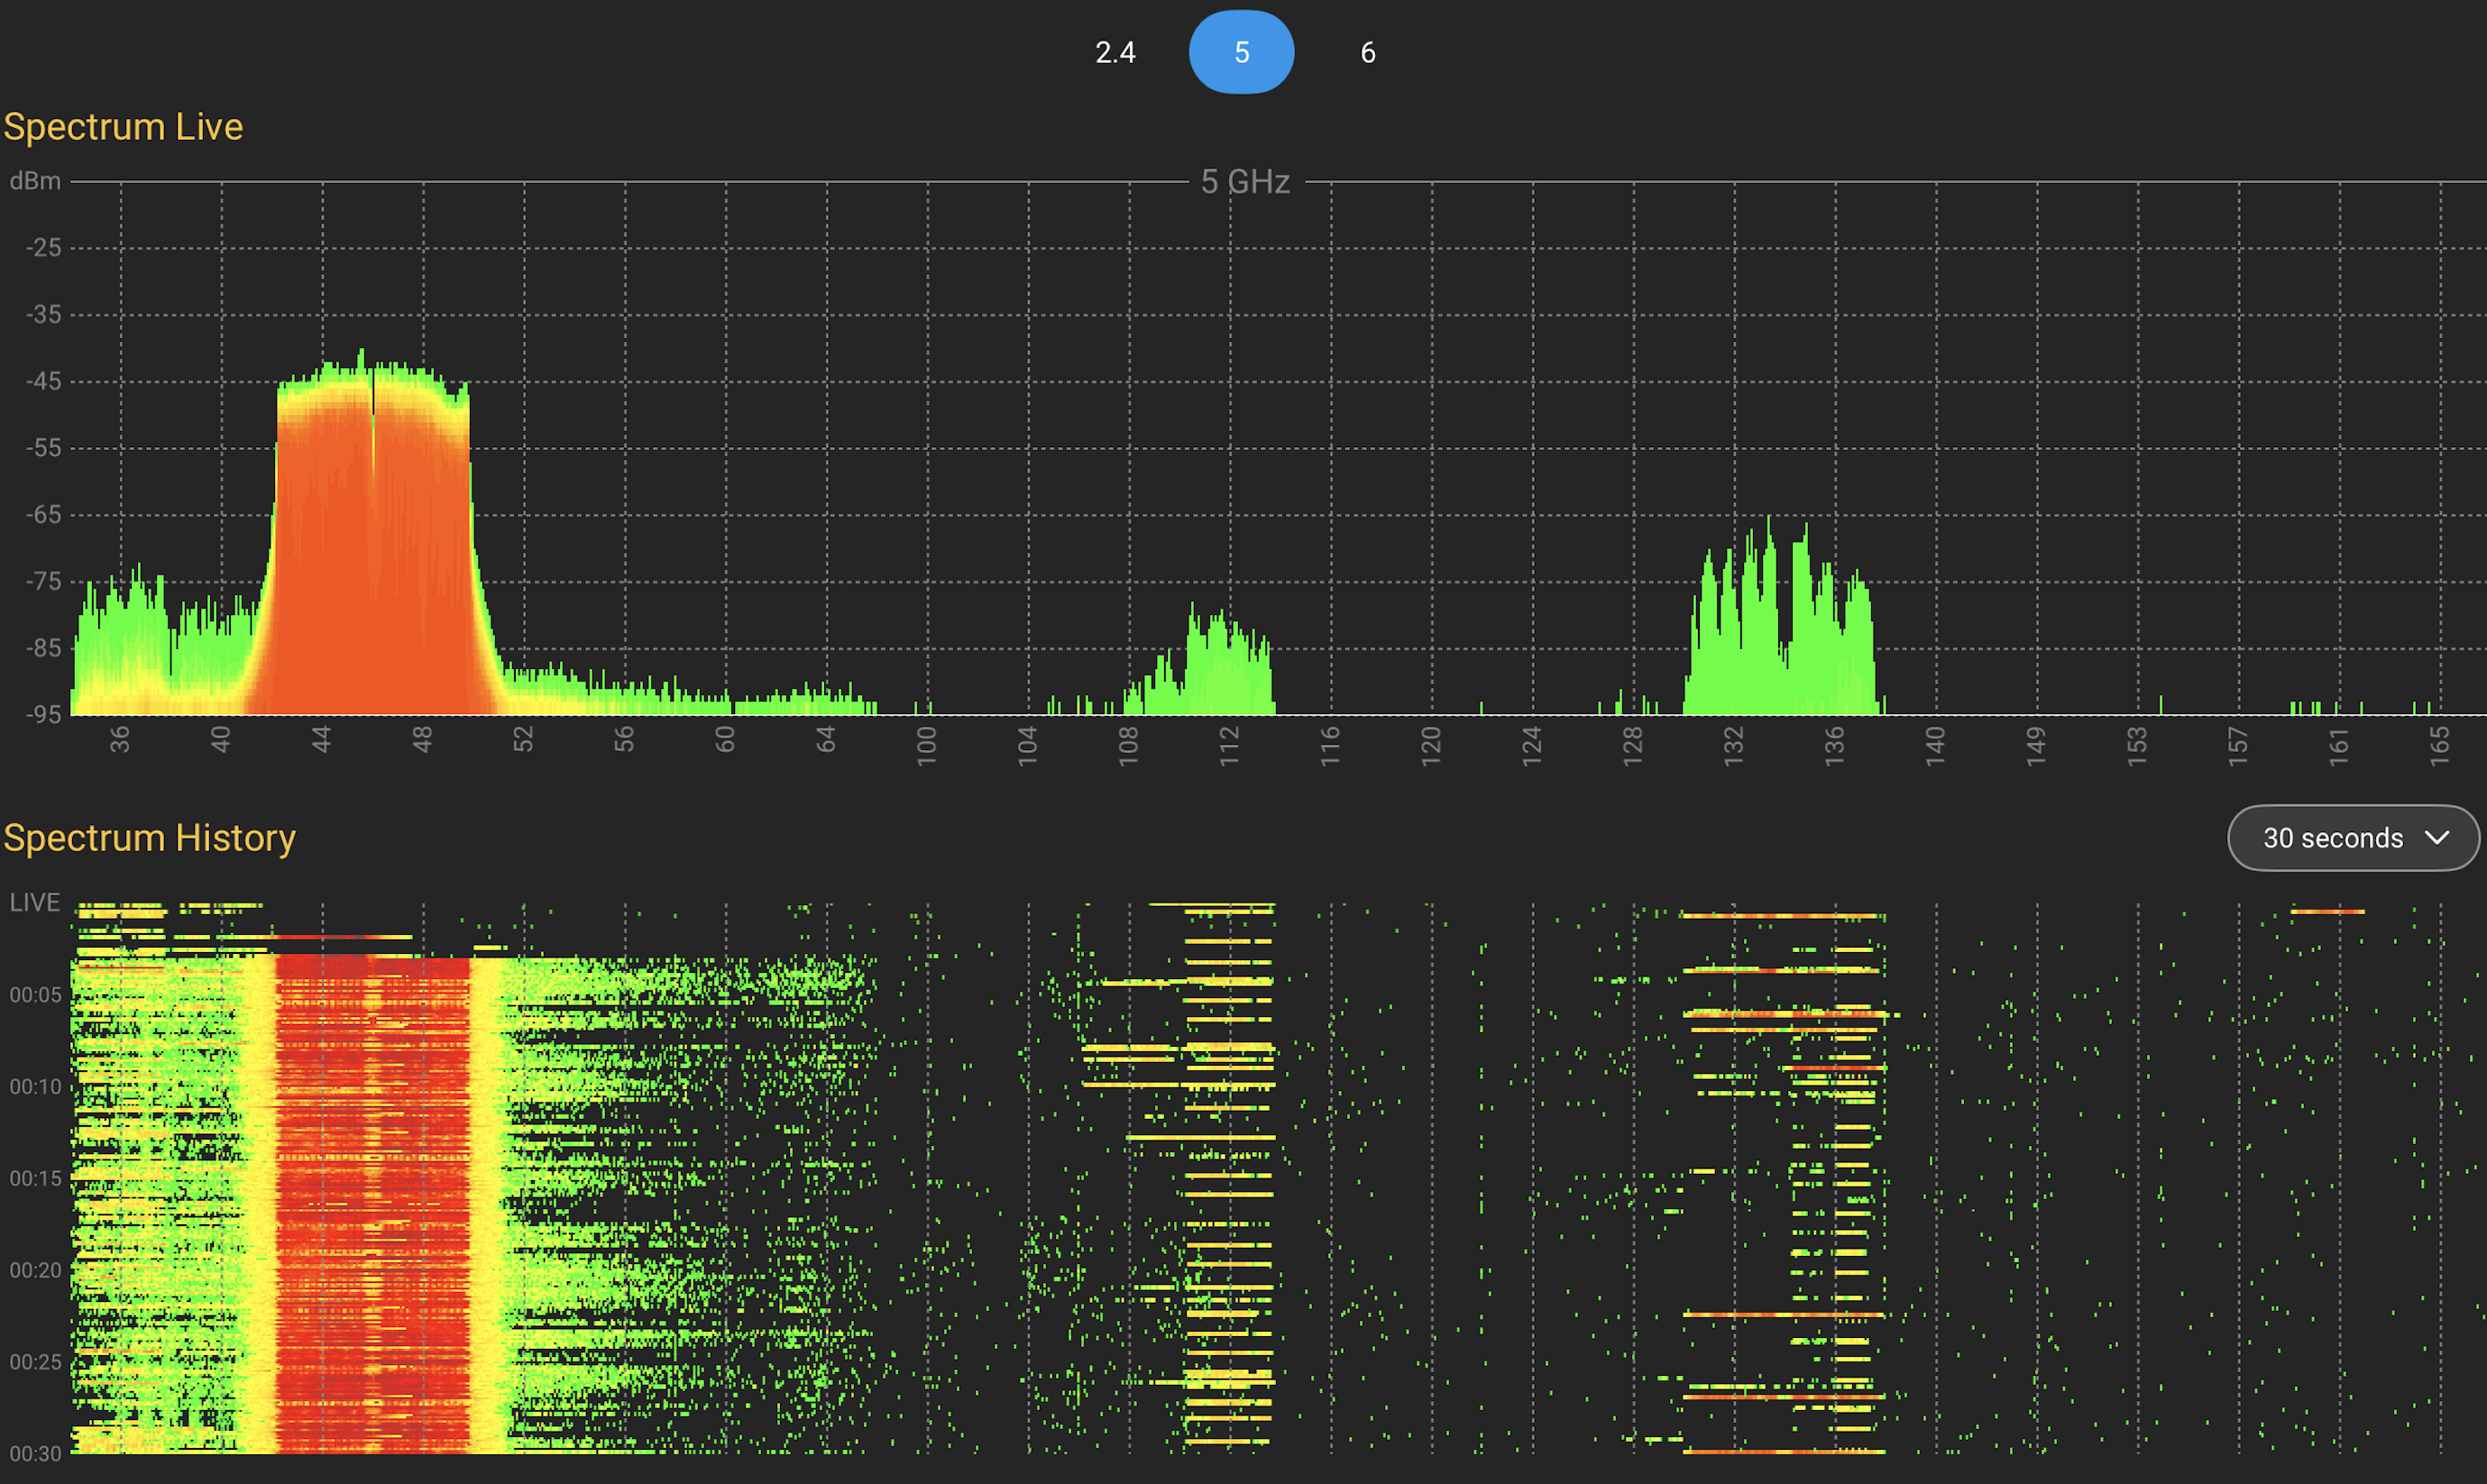
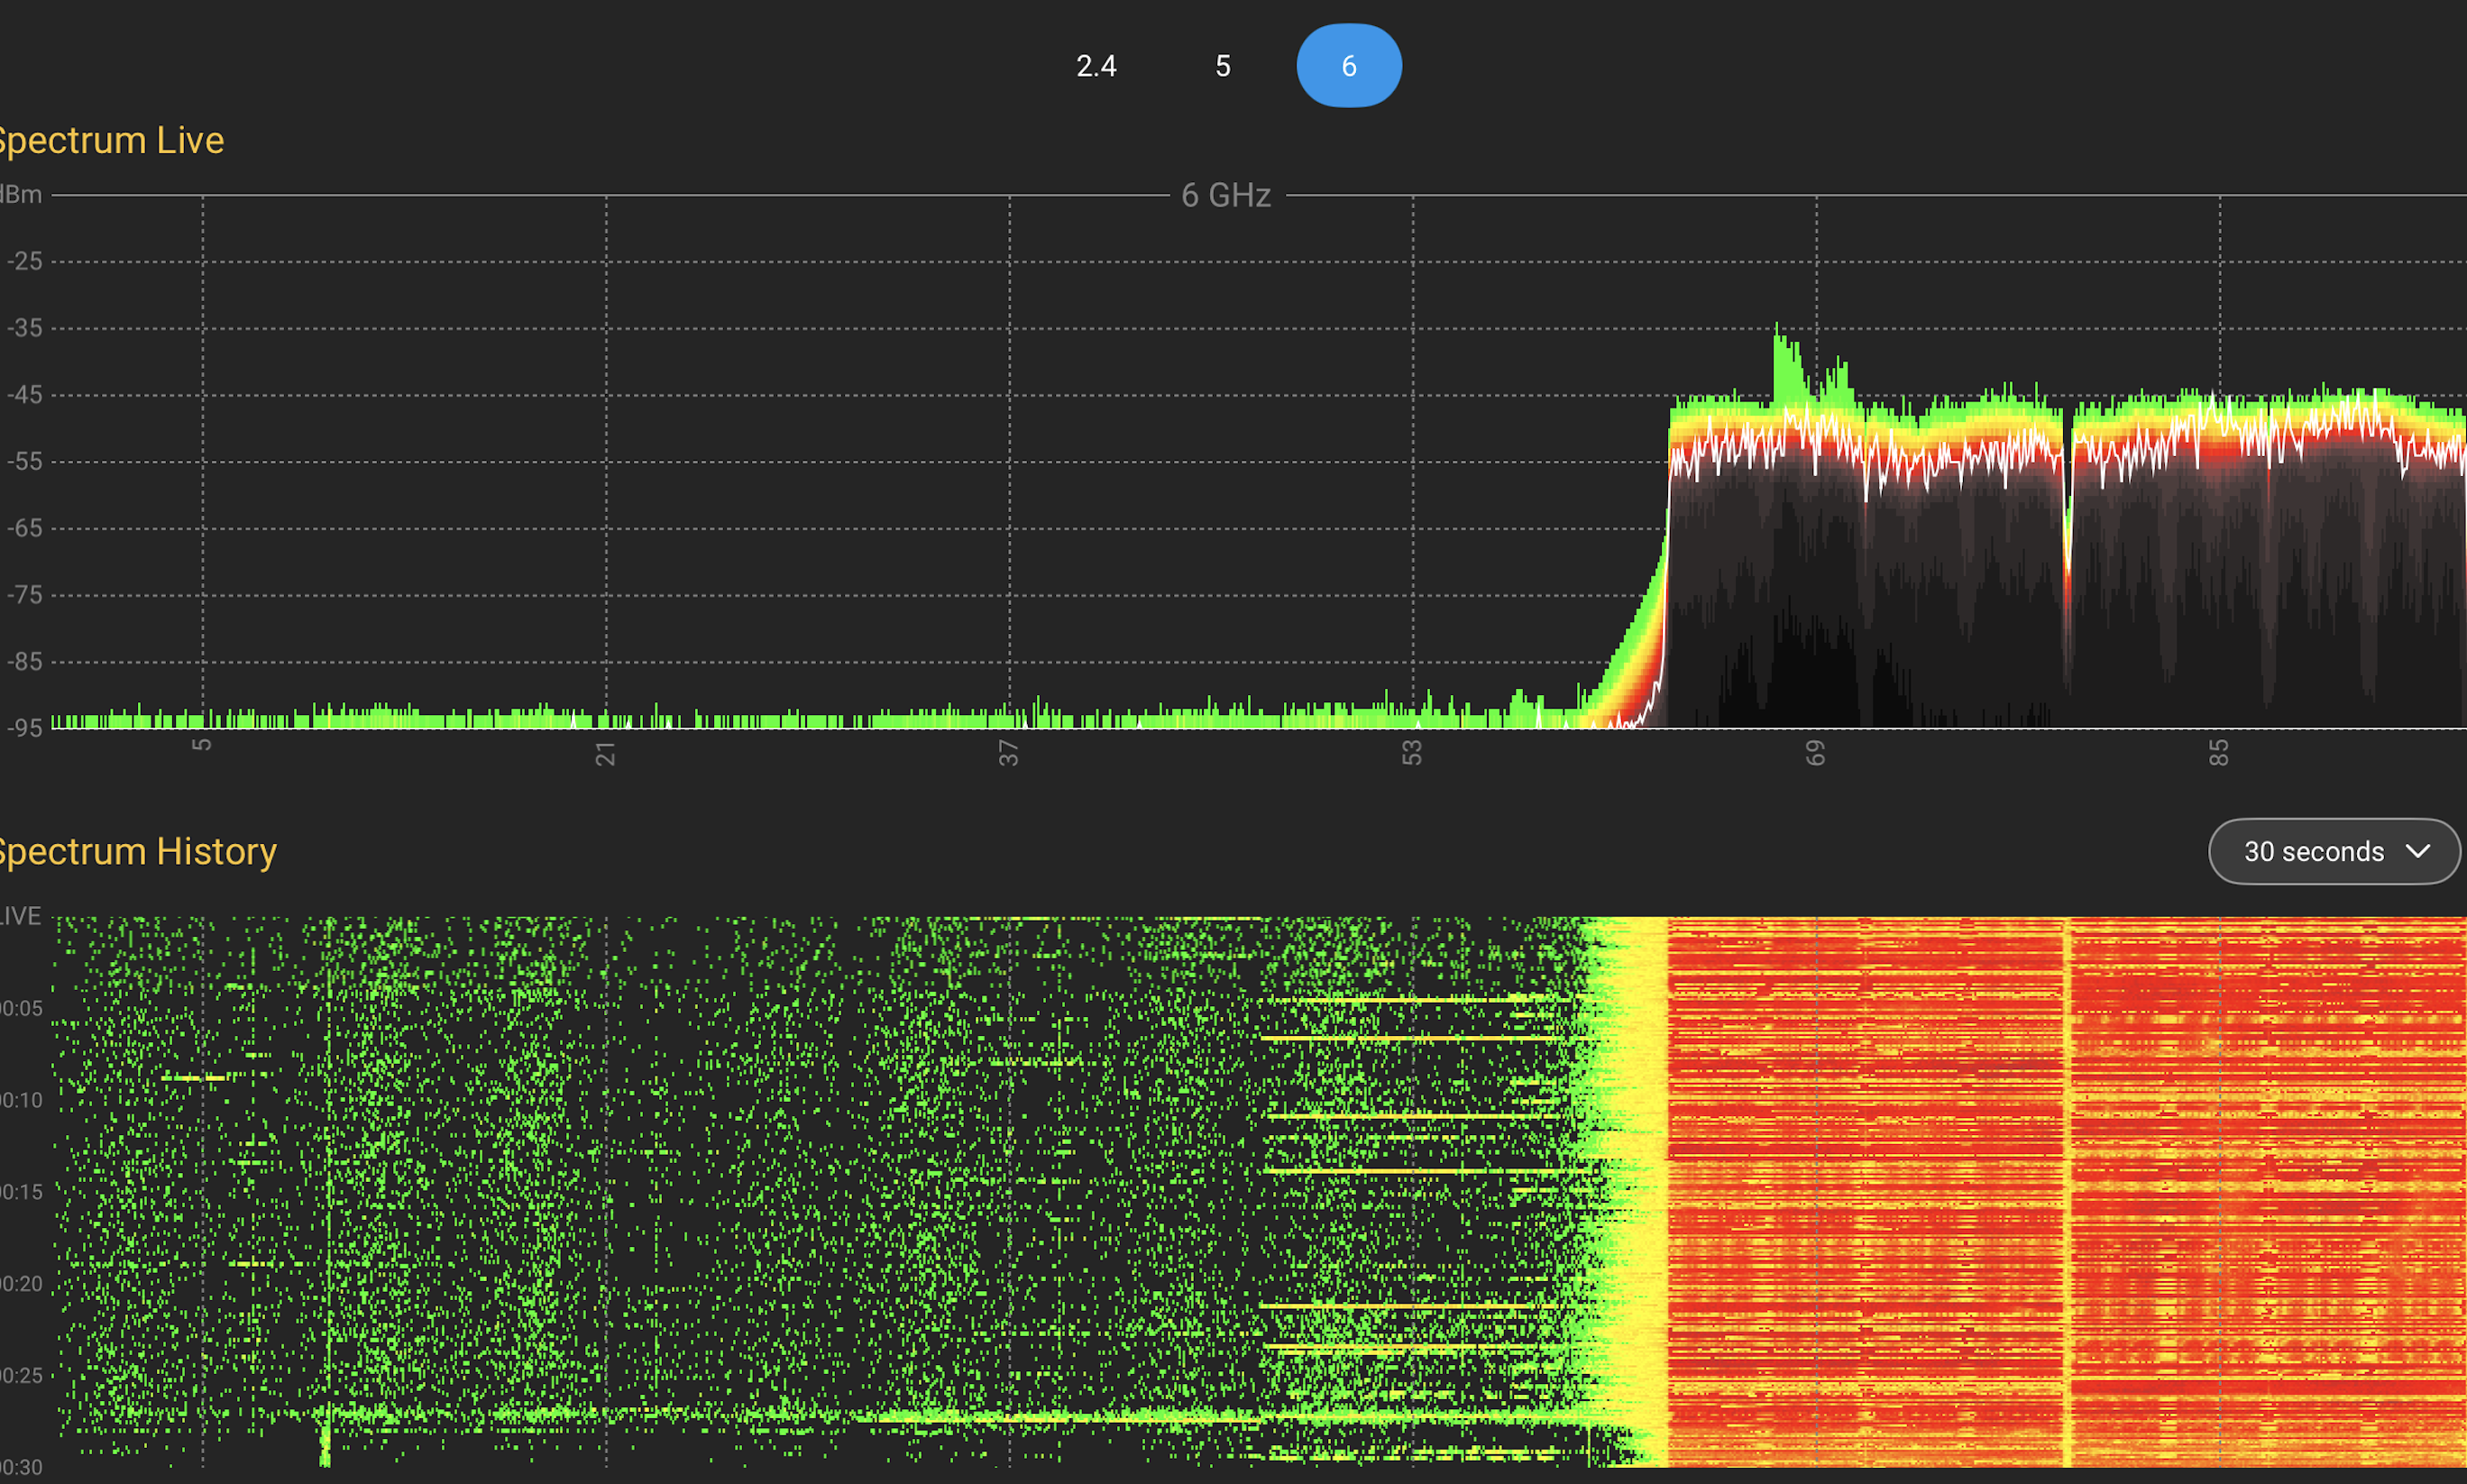
To confirm real RF activity, we also checked spectrum usage.
Test Plan
To avoid too many variables, we kept it simple.
| PoE Mode | Radio Power | Traffic |
|---|---|---|
| 30 W | full | idle |
| 30 W | full | load |
| 60 W | full | idle |
| 60 W | full | load |
Lower power tests were skipped intentionally.
We focused on realistic worst-case behaviour.
Results
The temperature curves all showed the same characteristic behaviour:
• fast warm-up after power-on
• exponential rise
• stable plateau
Classic thermodynamics at work.
Switching from idle → load produced visible temperature steps.
Switching from 30 W → 60 W increased the plateau further.
Exactly what physics predicts.
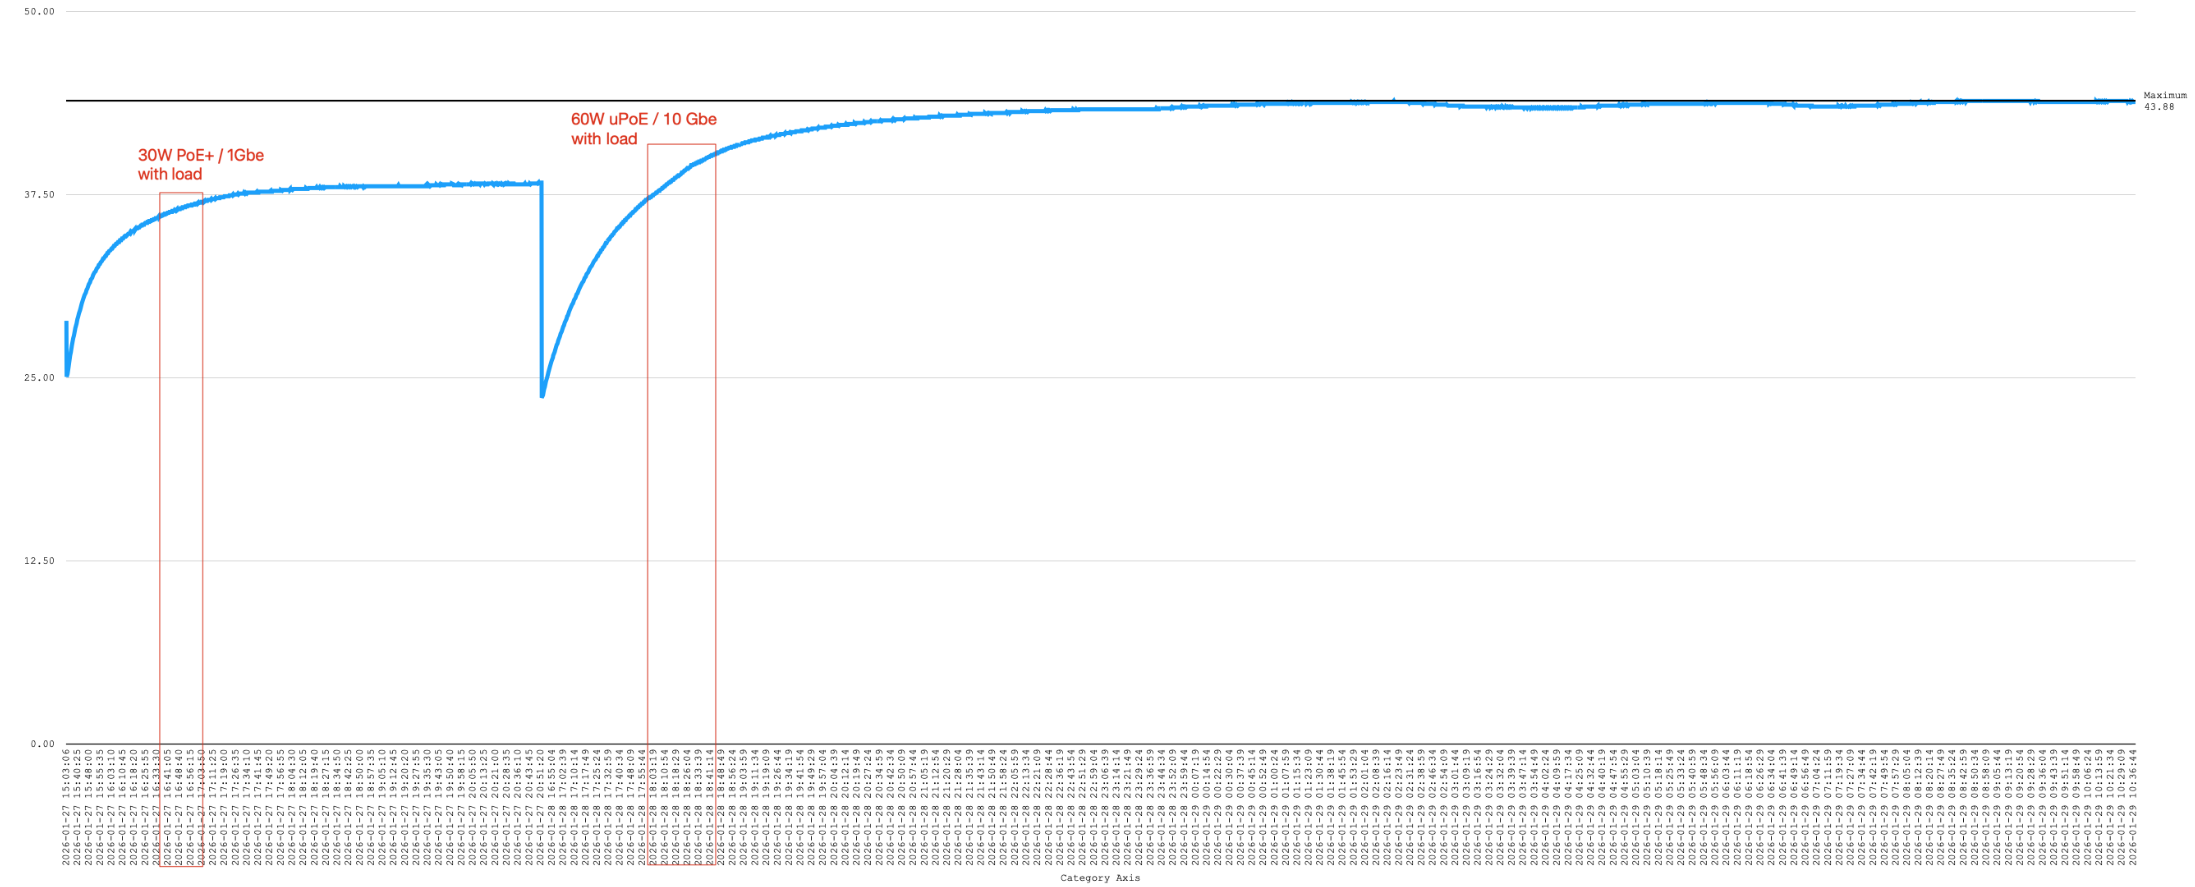
Maximum observed temperature
Across all tests:
43.86 °C
That was the highest value recorded.
No spikes.
No instability.
No runaway heating.
Interpretation
Even with:
• full radio power
• heavy TCP load
• 60 W PoE
…the enclosure stayed comfortably within Cisco’s specified operating range (0–50 °C).
So the box behaves more like a warm cupboard than an oven.
Good news.
What Could Be Different in Production?
Real life is always messier than lab tests.
Temperatures may increase with:
• higher ambient temperature
• direct sunlight
• more clients
• higher CPU load (FlexConnect, QoS, encryption)
• constant peak traffic
• poor airflow
• PoE inefficiencies
So treat this as baseline guidance, not a guarantee.
Conclusion
A €10 microcontroller and a temperature sensor answered a question that could otherwise cause weeks of speculation.
Instead of guessing:
We measured.
Instead of theory:
We logged data.
And the result is reassuring:
The Cisco 9176 runs safely inside the existing enclosure — even under worst-case load.
Sometimes the best engineering tool isn’t a complex monitoring system.
Sometimes it’s just:
a tiny board,
a resistor,
and curiosity.